API |
| The Flowlink Cipher API has been improved with several changes that are intended to simplify the retrieval of data from the database.
Key changes to the v2 endpoints:
1. Simplified URL structure
- Human-readable site names ({siteName}) instead of UUIDs
2. Consolidated data export
- Streamlined and centralized approach to exporting:
GET /api/v2/export/sites: Lists all sites
GET /api/v2/export/site/{siteName}{}: Retrieves devices and quantities for a site
GET /api/v2/export/site/{siteName}/data: Exports quantity data in CSV or JSON
3. Flexible query parameters
- Device filtering via device query parameter
- Selective quantity export via comma-separated quantities
- Time range filtering via start_time and end_time in ISO format
4. Improved format support
- Support for CSV output in addition to JSON, making it easier for integration with spreadsheets and data tools |
Dashboard |
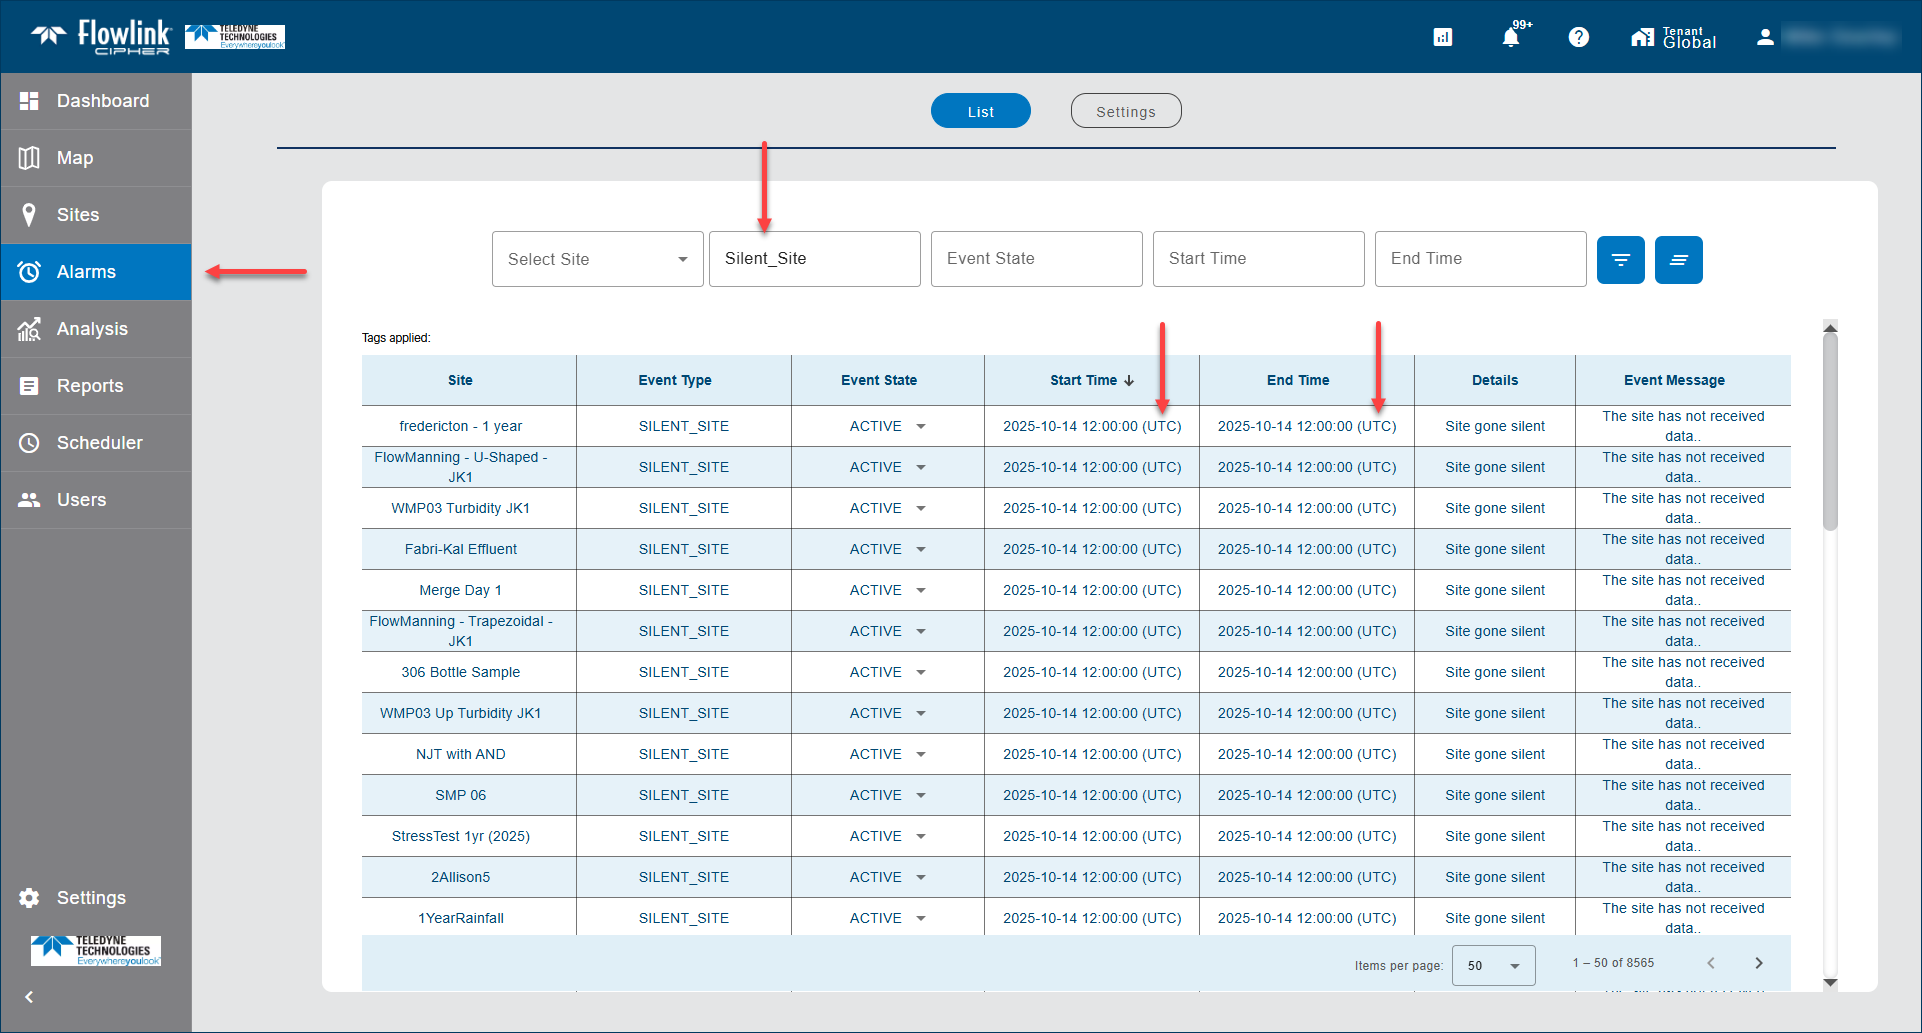
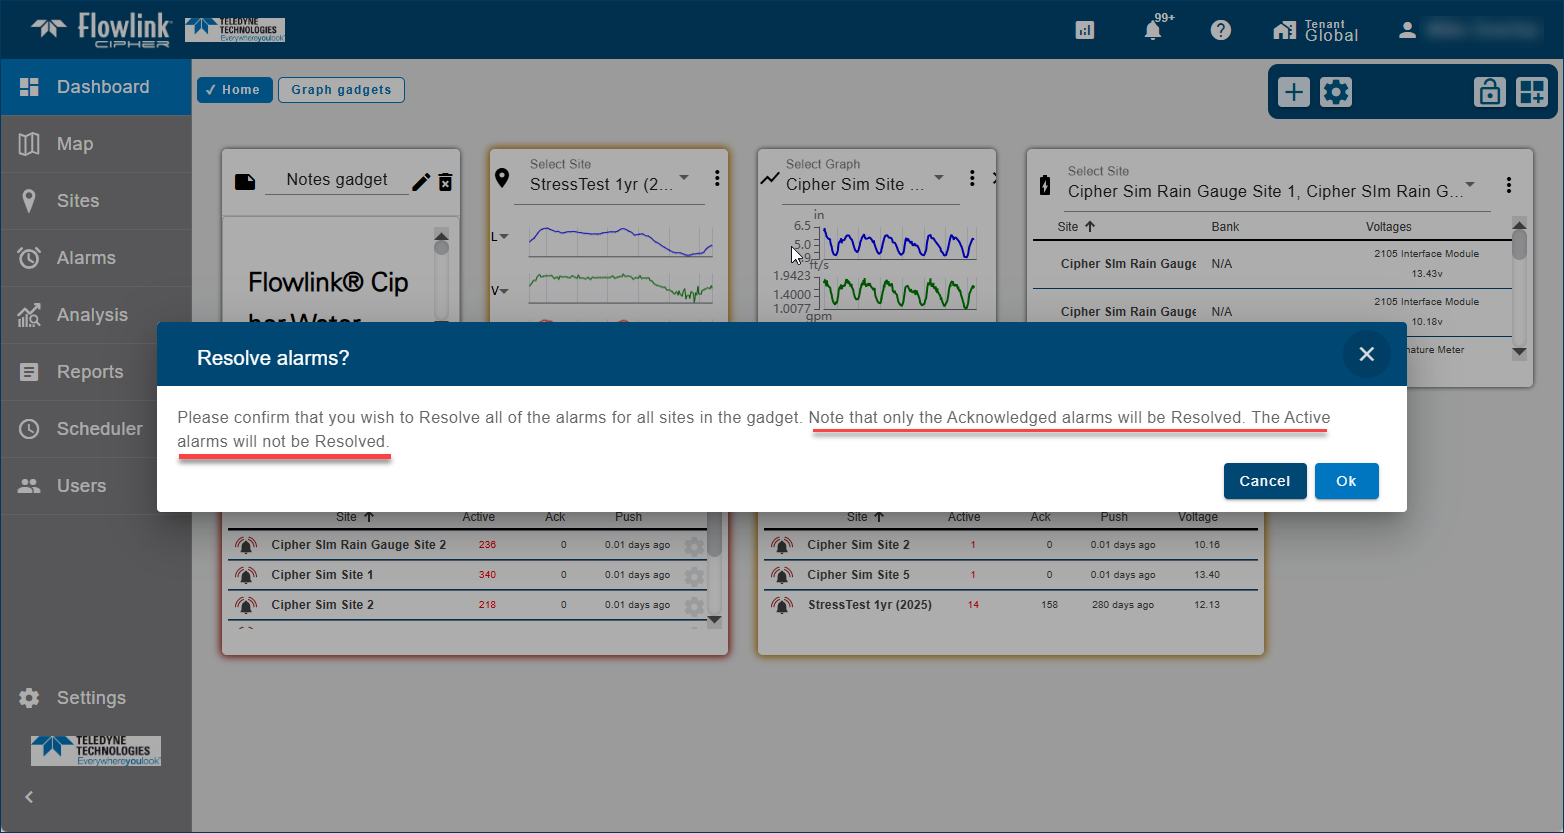
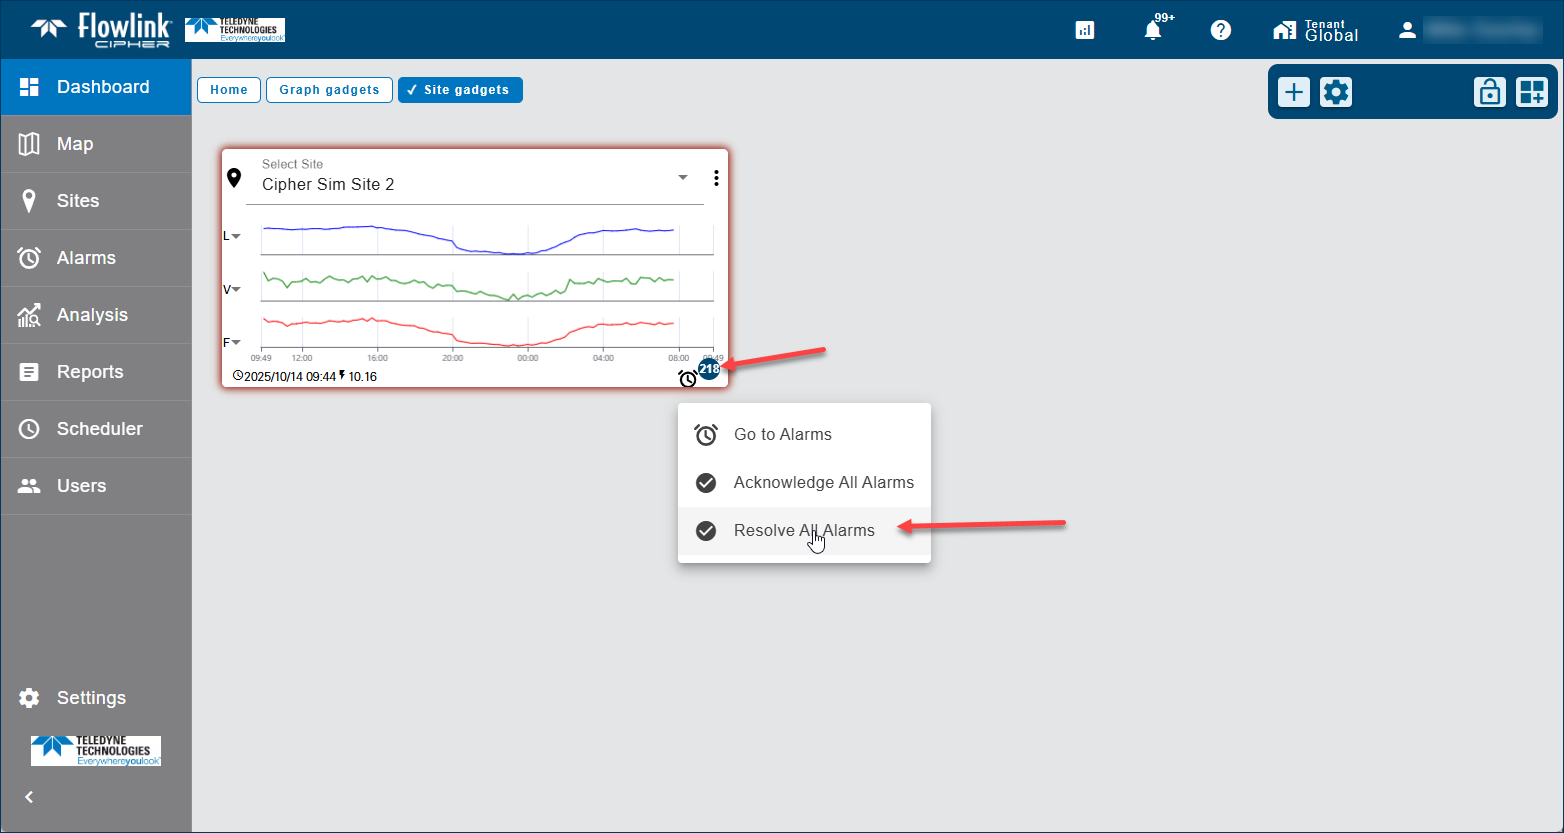
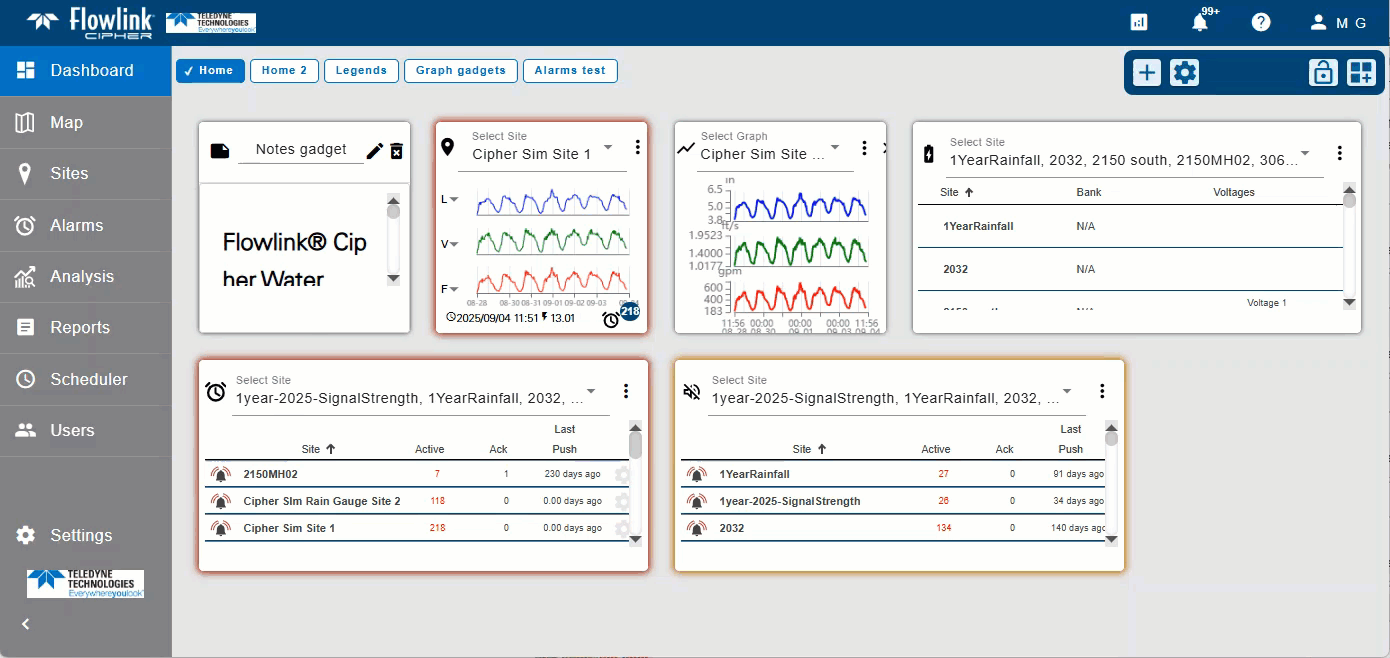
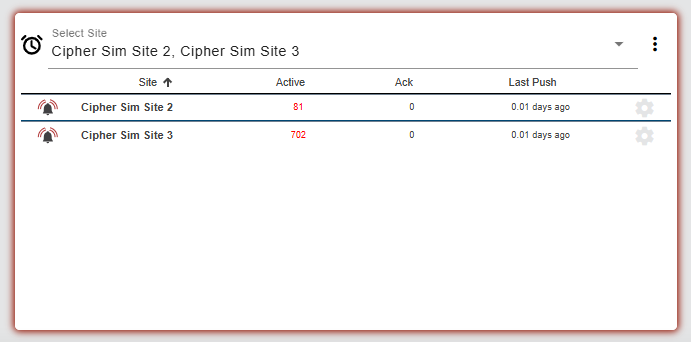
| The Alarms gadget will now continue to glow with the red color while there are Data events for the sites selected for the gadget that are Active or Acknowledged. The red glow will be removed automatically when the Data events for the sites selected for the gadget site are Resolved.
|
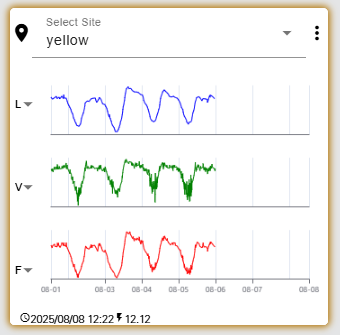
| The Site gadget will now continue to glow with the yellow color while there are Silent Site events for the site that are Active or Acknowledged. The yellow glow will be removed automatically from the Site gadget when the Silent Site events for the site are Resolved.
|
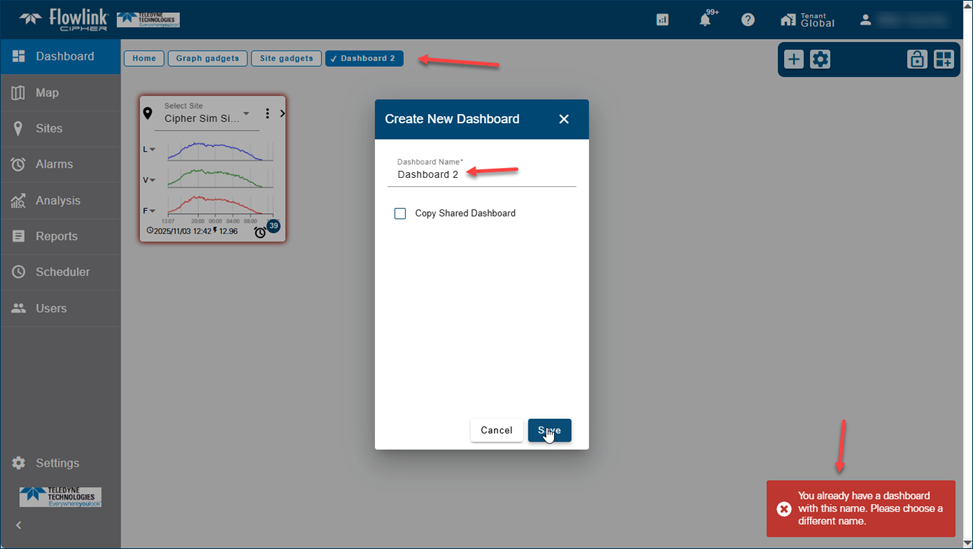
| The Dashboard toolbar with functions to create, modify and lock the dashboard has been updated. The functions available will now differ depending on the state of the dashboard.
- Unlocked, no unsaved changes: The dashboard is unlocked and the Create New Dashboard, Manage Dashboards, Lock Dashboard and Add Gadget functions are enabled in the toolbar. Any changes can be made to the current dashboard and other dashboards.
- Unlocked, with unsaved changes: The dashboard is unlocked and Save and Cancel buttons are added to the toolbar to save the changes to the dashboard. The Create, Manage and Lock functions in the toolbar are disabled; only the current dashboard can be edited while there are unsaved changes.
- Locked: The dashboard is locked and cannot be changed. The Create and Manage functions remain enabled to add/edit other dashboards.
|
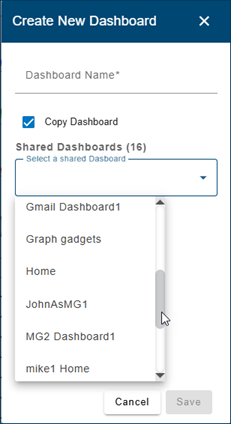
| Dashboards named 'Home' can now be renamed or deleted. Also, it is now possible to delete all dashboards, leaving the Dashboard screen clear, and new dashboards can be created. |
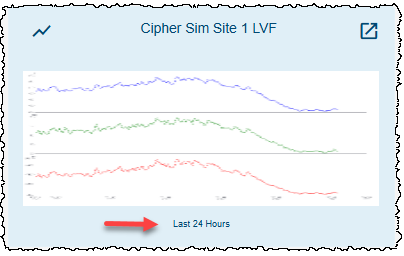
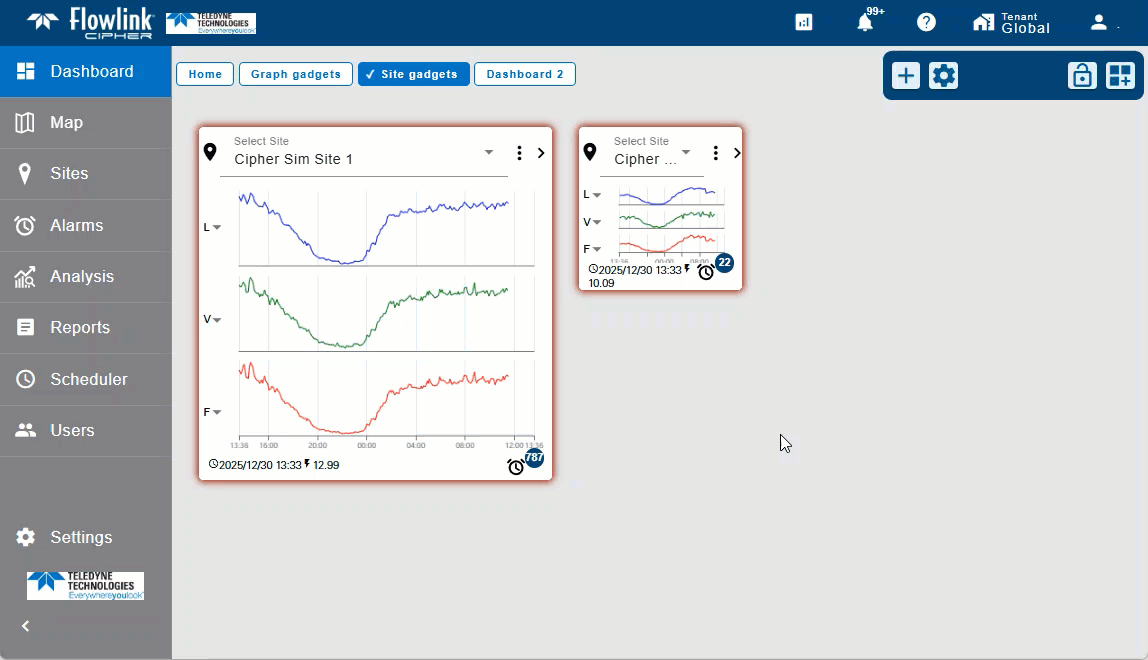
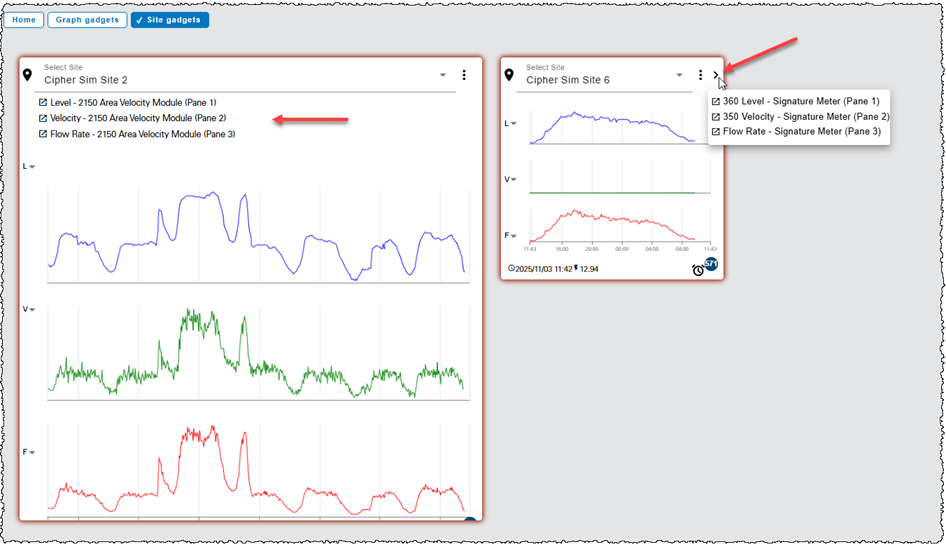
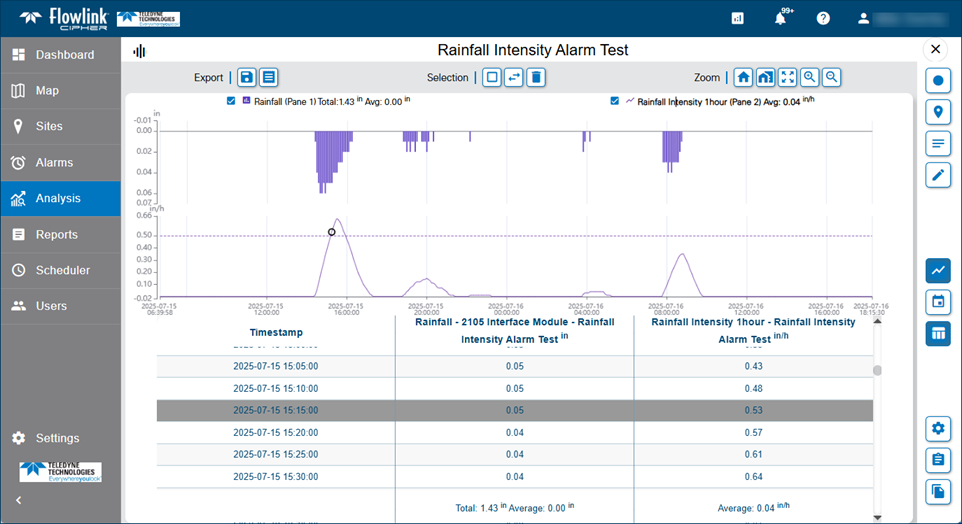
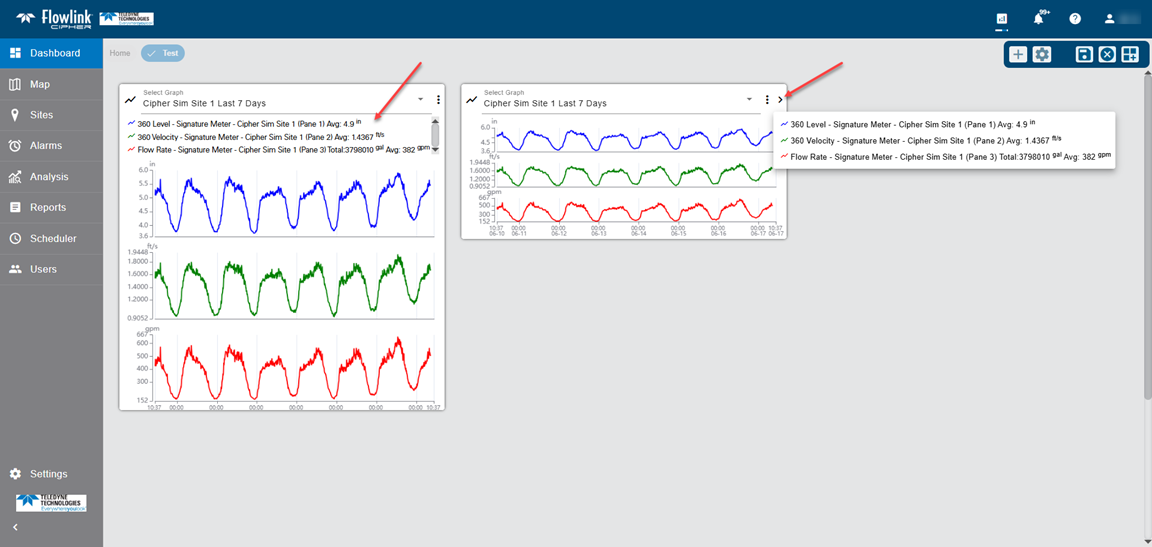
| The Graph gadget on the dashboard now has a legend. The legend is displayed above the graph panes only when the gadget is tall enough. When the gadget is short, click the right arrow button in the top-right corner of the gadget '>' to display the legend in a pop-up.
|
General Application |
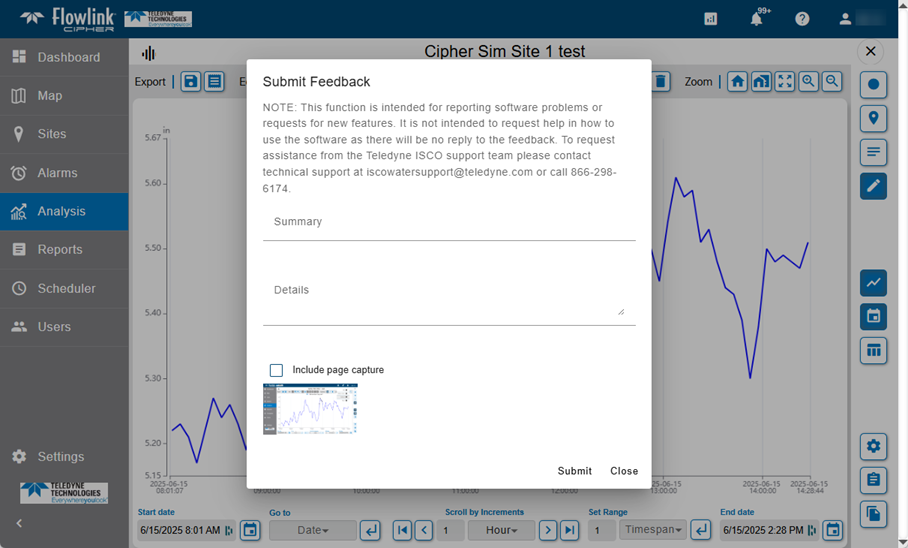
| The 'Submit Feedback' function now includes a note reminding the user that the function is for reporting software problems and requests for new features. The Feedback function is not intended for obtaining help in how to use functions and procedures in Cipher. To obtain help in how to use Cipher contact Teledyne ISCO at iscowatersupport@teledyne.com or call 866-298-6174.
|
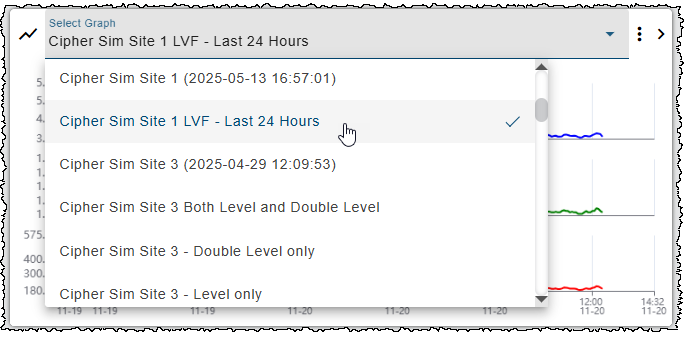
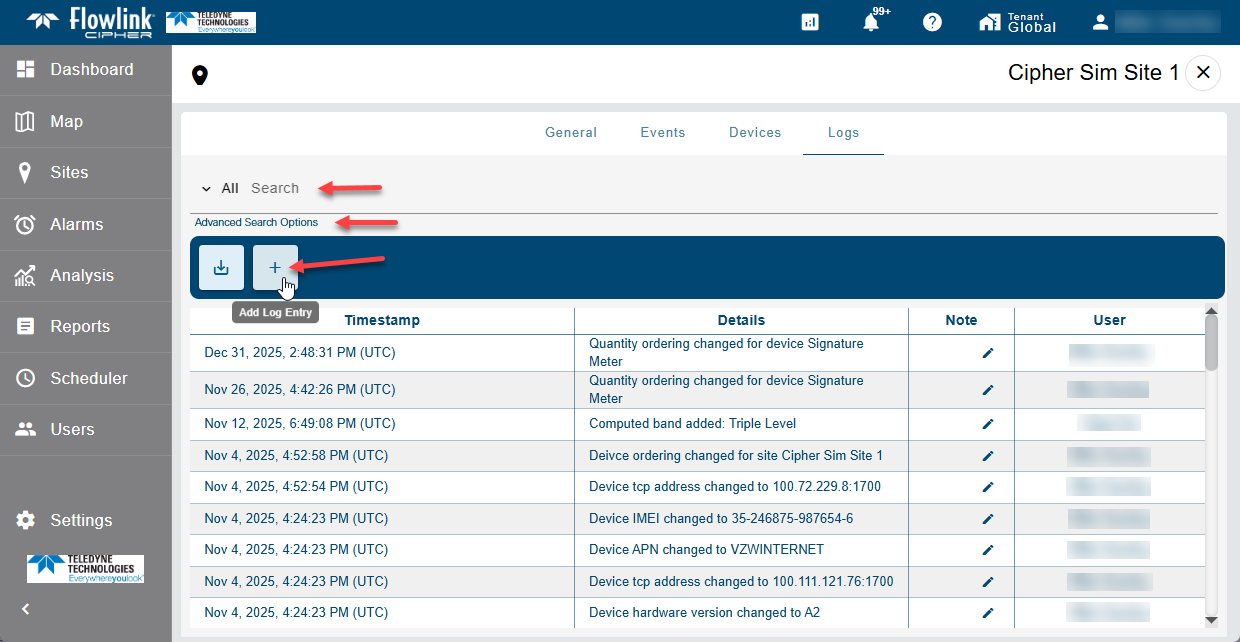
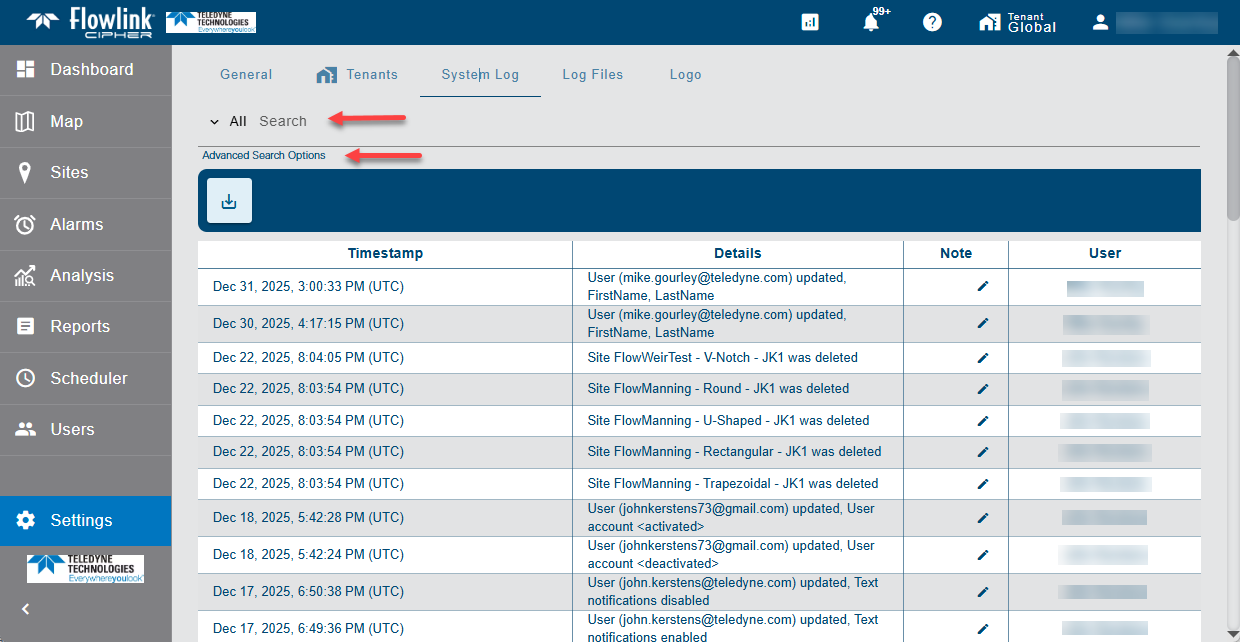
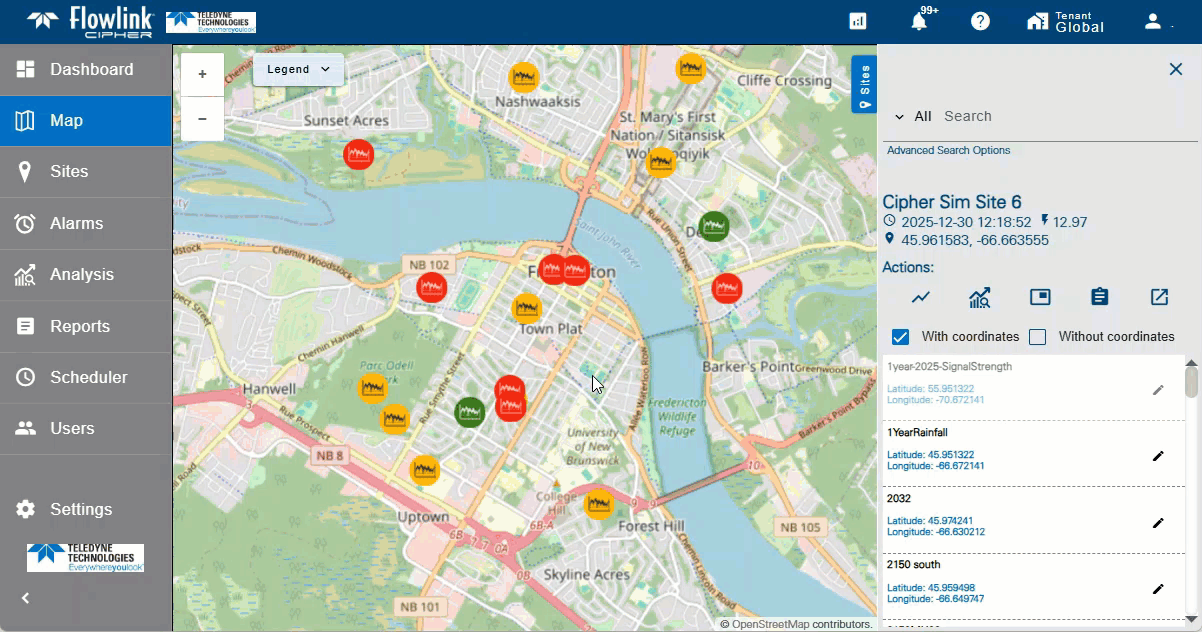
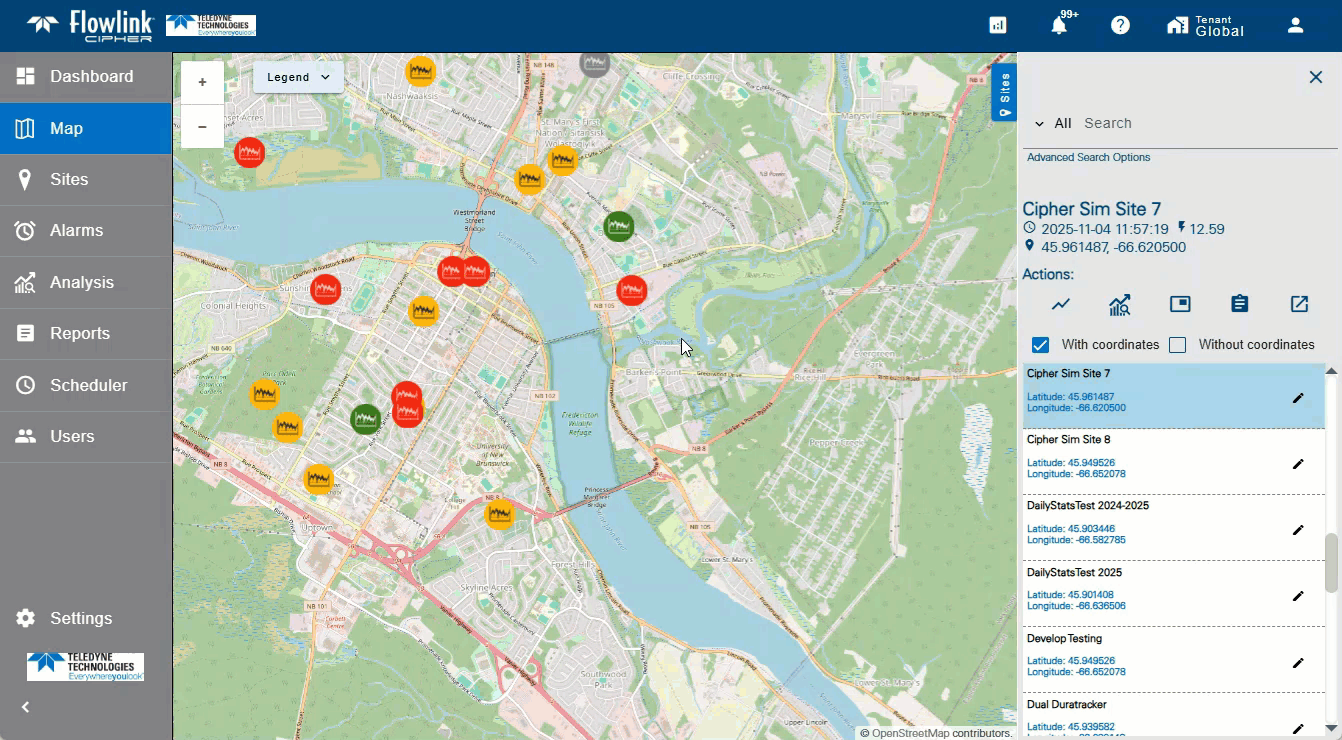
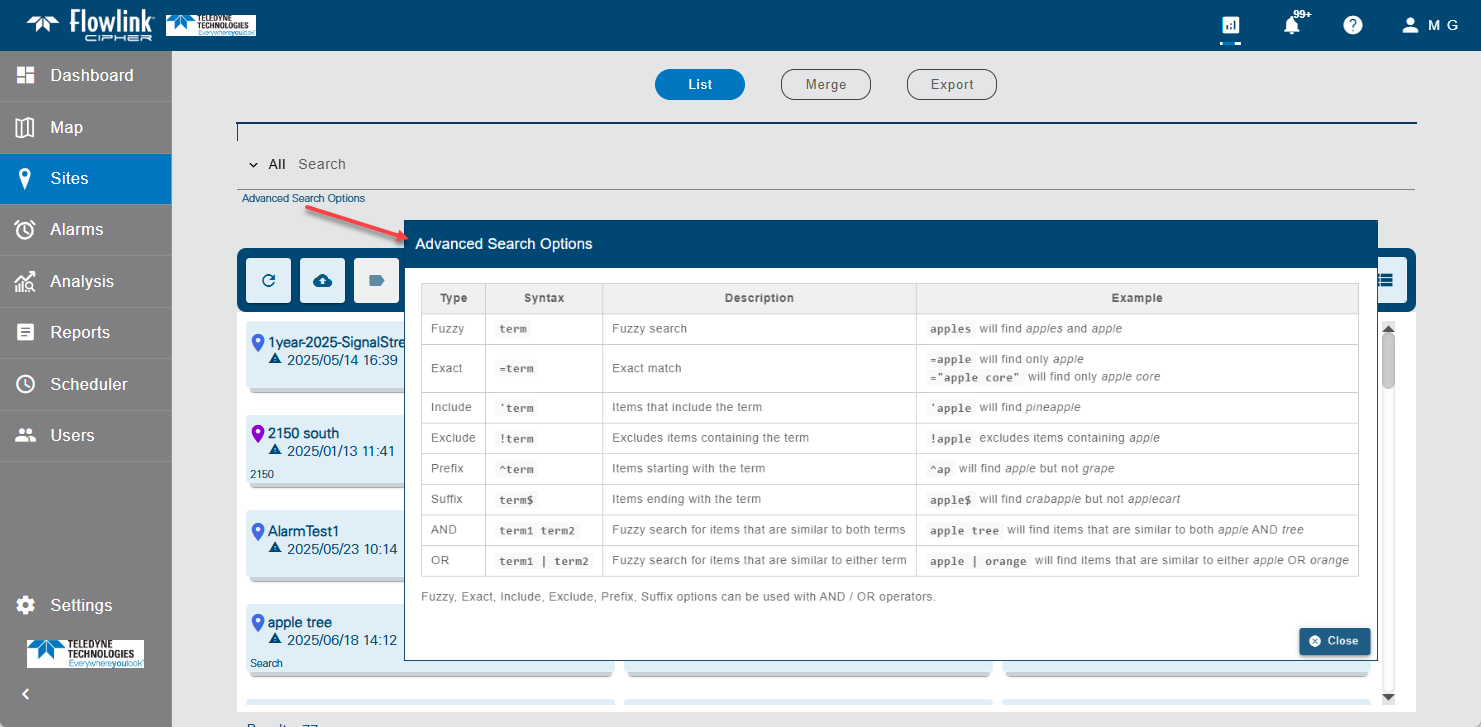
| New Advanced Search Options have been added to all locations where the user needs to search for and select a site. The Search options include Fuzzy, Exact, Include, Exclude, AND, OR, Prefix and Suffix.
|
Graphs |
| The 'Auto Correct' edit function has been replaced with two functions: 'Linear Correct' and 'Smooth Correct'.
|
| The function 'Clear all selected points' has been added to the graph screen when in edit mode. This will deselect all points that have been selected.
|
| 'Select points by rectangle' has been enhanced by allowing multiple groups of points to be added to the selection by pressing the Ctrl key and adding more points to the selection.
|
| A new selection method has been added to the graph edit mode.
1. Select the 'Select points by time range' function.
2. Click and drag the mouse cursor left or right, then release when the desired range is reached. This will select all of the points within the highlighted time range.
3. Use the Ctrl key to select additional time ranges to add more data to the selection.
|
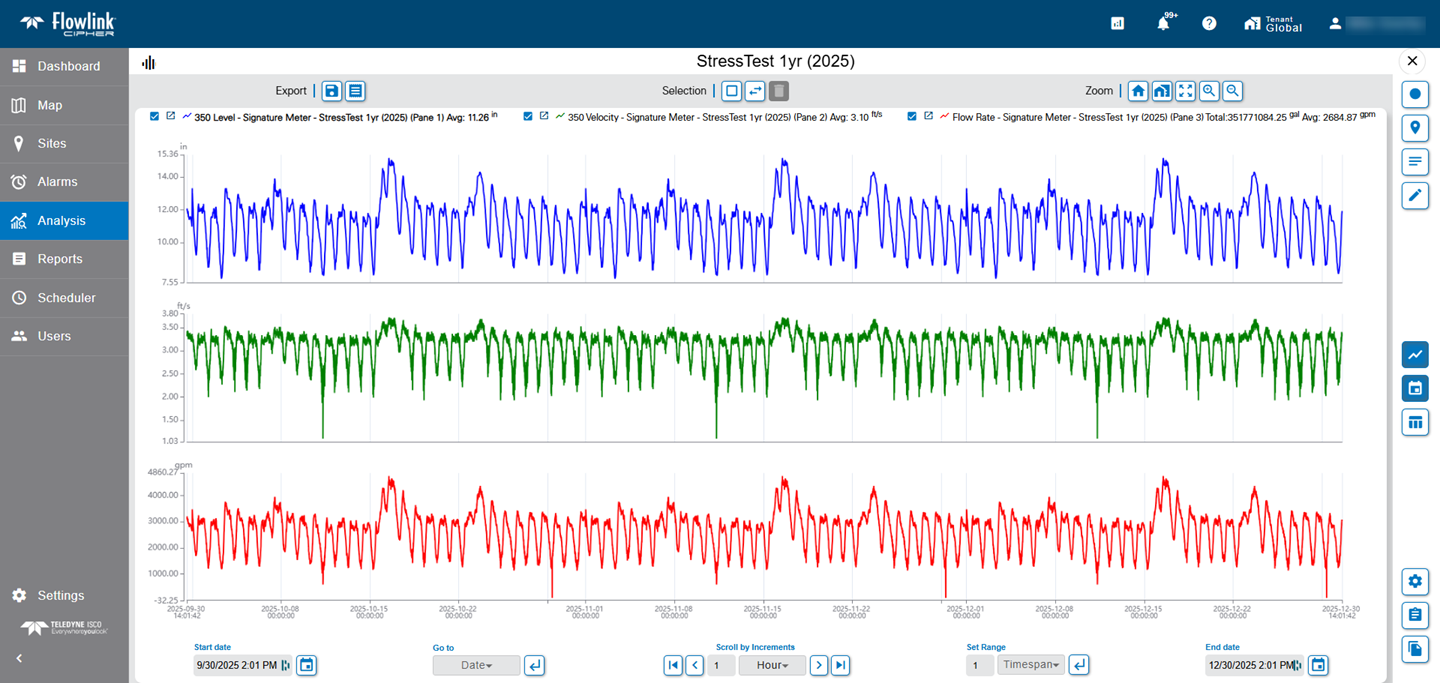
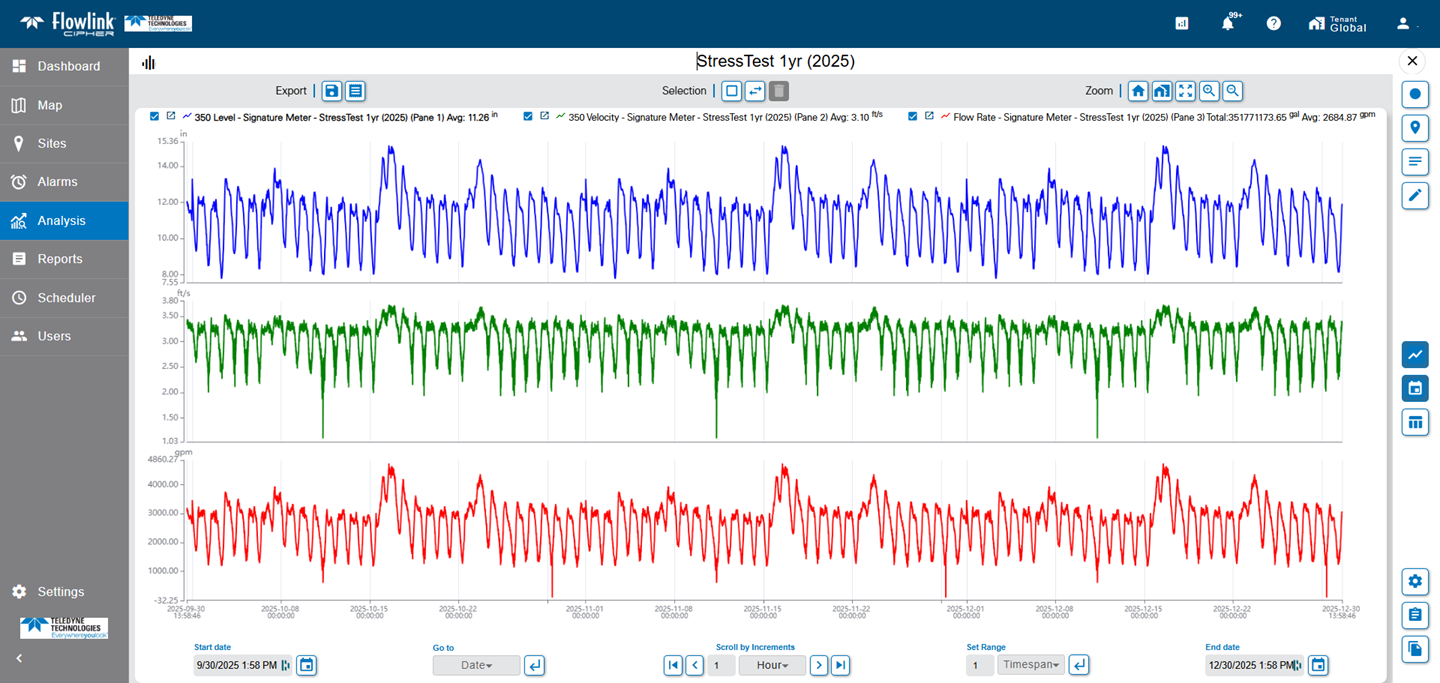
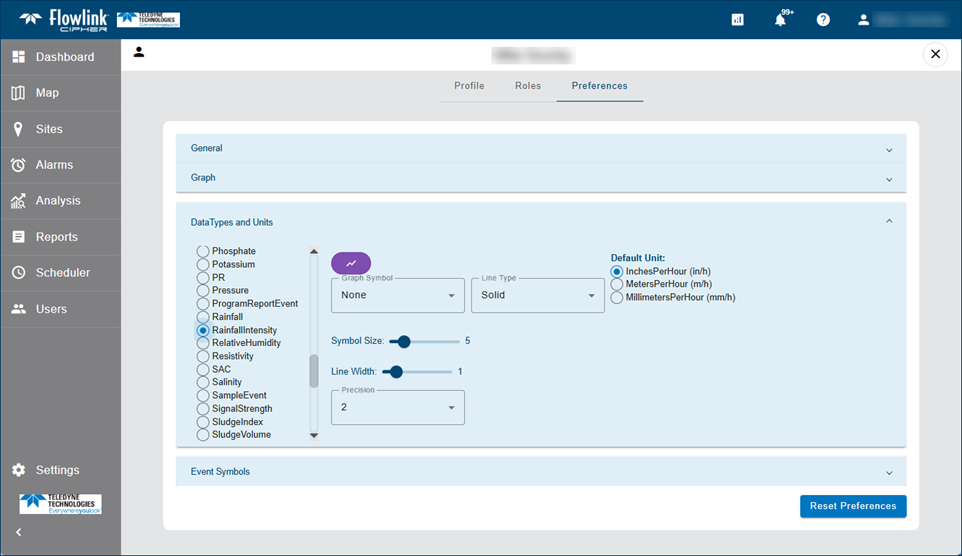
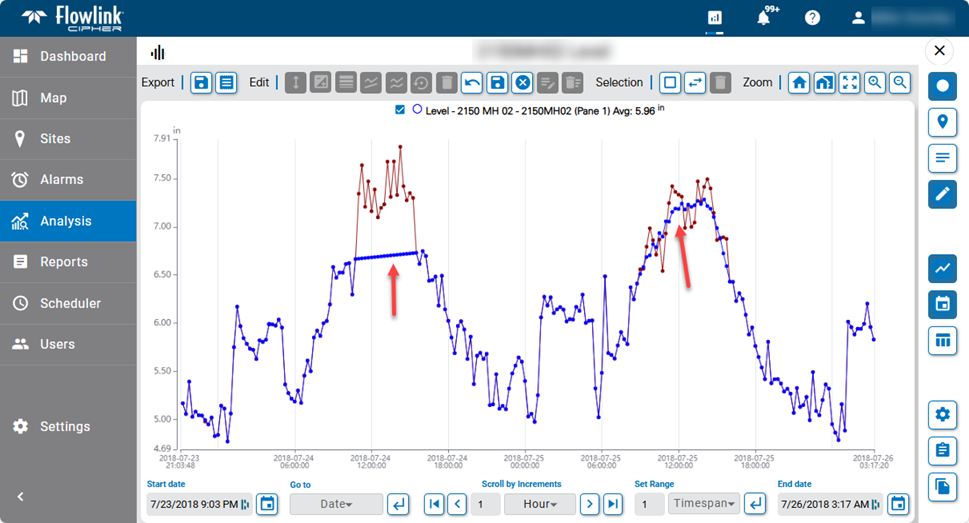
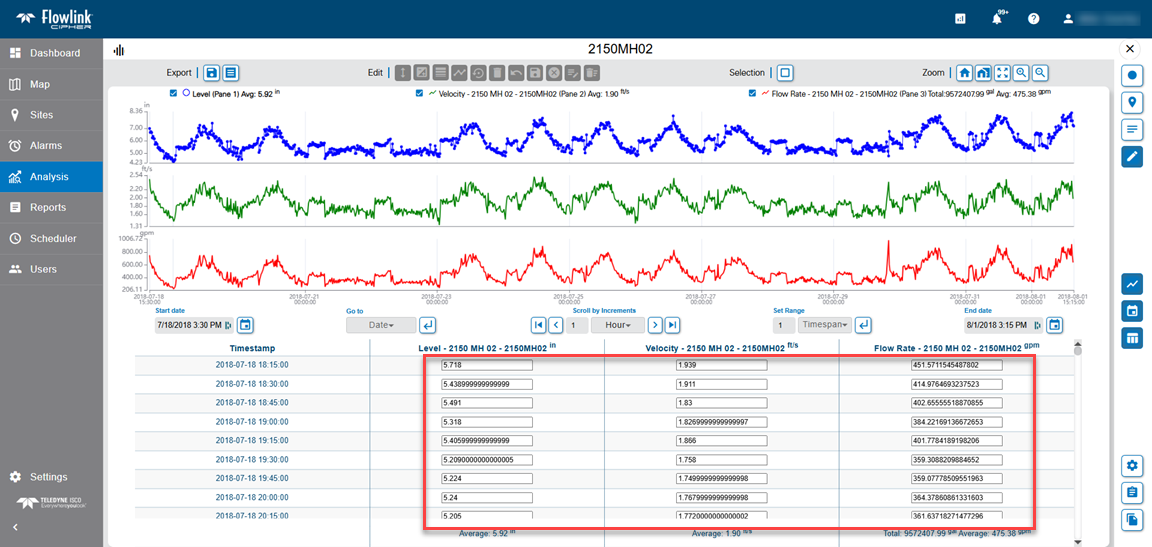
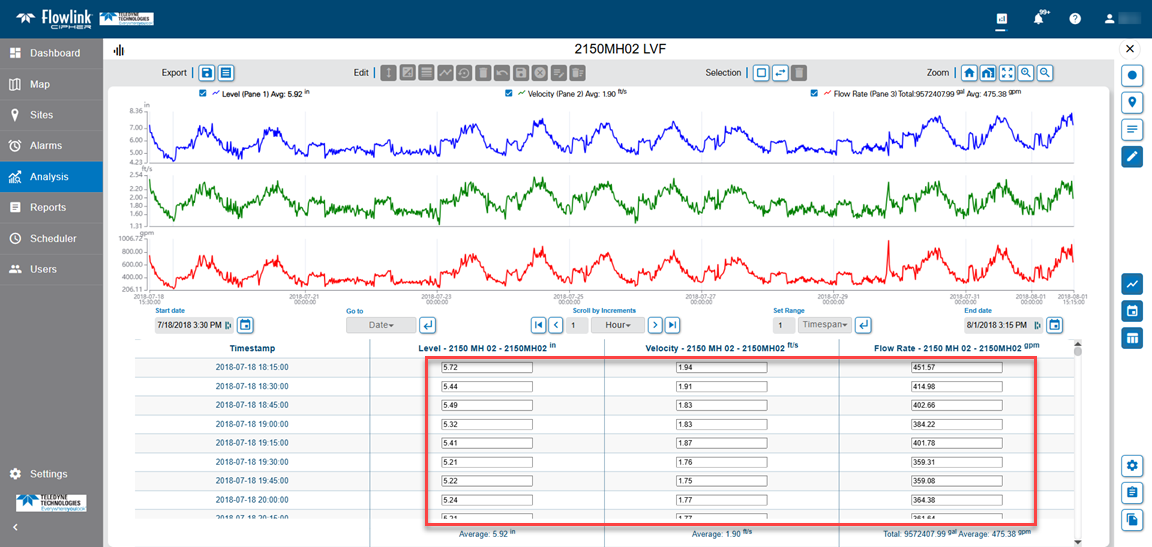
| Previously, when the graph was put into Edit mode and the table was displayed, the quantity values in the table would display in their full precision as stored in the database and converted to the display units. This has been changed. The graph table in Edit mode will now display the values with the precision as defined by the display property settings for the graph, which defaults to the User Profile Preferences settings for precision for each quantity data type. The following is a BEFORE versus AFTER comparison of the graph table in Edit mode.
BEFORE
AFTER
|
Sites |
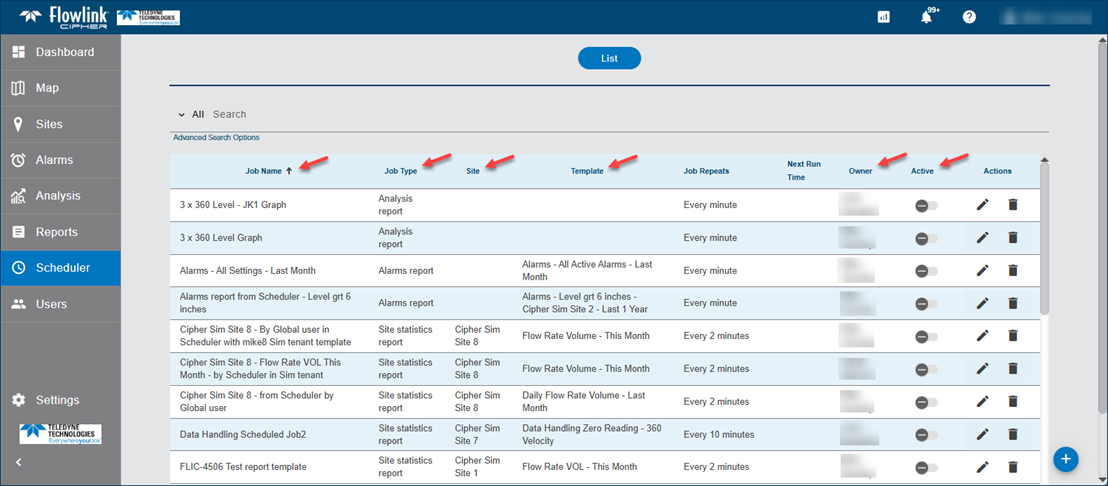
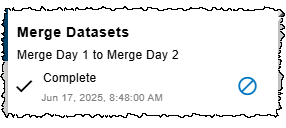
| The Sites > Merge function has been updated to generate only one job per execution. Previously, the function generated one job per quantity included in the Merge execution. As a result, the Jobs drop-down list now contains the one job indicating the Source and Destination sites instead of multiple jobs.
|