Flowlink Cipher 1 : Flowlink Cipher Release Notes : Flowlink Cipher 1.8
 

Flowlink Cipher 1.8

This section describes all changes made to the application in the 1.8 series of releases.

1.8.3

June 2025

Enhancements

Flowlink Cipher

Alarms

When configuring a new alarm setting the default time unit for the 'duration' and 'within' options is now minutes. Previously the default unit was seconds.

API

Documentation of the Flowlink Cipher API is now available for all customers by adding /swagger-ui/index.html to their Cipher deployment URL. For example, the API documentation for deployment us2 is...
https://us2.flowlinkcipher.com/swagger-ui/index.html

Dashboard

The Dashboard has been upgraded to provide a locking capability where the gadgets on the dashboard cannot be added, removed, moved or resized unless the dashboard is placed into an edit mode. The buttons to switch between dashboards are located in the upper left corner. The buttons in the upper right corner include: "Create new dashboard", "Manage dashboards", "Edit layout" and "Add gadget".


When the "Edit layout" is selected the dashboard enters an edit mode and the "Save" and "Cancel" buttons will appear and the "Add gadget" is enabled.


Manage Dashboards

Events

The display of events in the main graph screen has been updated. A new events pane will appear on the bottom of the graph when Display Events button is turned on. Select one or more event types to display on the event pane. Hover the cursor over the symbols to see the tooltip. Click the tooltip for the Data, Diagnostic, History and Summary event types to open the display of the event.


The color, symbol and symbol size for each event type is defined in the user's preferences.

General Application

Flowlink Cipher now supports a SignalStrength data type with units of Decibel (dB).


The Jobs list now displays the timestamp when the job completed. Hover the cursor over the job and the created time of the job is displayed in a tooltip.

Map

The Sites panel in the Map screen has been updated to include checkbox filters for sites "With coordinates" and "Without coordinates".

Scheduler

The list of Scheduler jobs can now be filtered using a selected Tenant. The filtered list will include the Site statistics jobs configured for sites in the selected Tenant.

Tags

Site Tags that were assigned to sites in the List View are now visible on the site cards in the Grid View.

TEMP

The Template Editor for graph templates now has controls to set the Precision for each quantity in the template.

User Accounts

The Data Types and Units panel in the user's Preferences now contains a Precision setting for every data type. The default value is 2 but the user can change to any value between 0 and 10. The user's preferences for Precision for each data type will then be used in the graph display properties, the statistics report and the sites export functions.

User Preferences


Graph display properties


Statistics report


Sites export

Maintenance

Flowlink Cipher

Alarms

When creating or editing an alarm setting the user can set a "within" option for Rainfall data. The "within" option was not always appearing when Rainfall data was selected. This has been fixed.

Computed Datasets

The Area Velocity and Level to Area computed dataset functions require Level and Velocity data as inputs. Previously if there were datapoints in which one of the quantities was empty the display of the computed dataset in the graph would cause all of the quantities to not be displayed. This has been solved by adding the "Interval (min)" option to the functions which defaults to 15 minutes in both functions.

Notifications

In the Notifications sliding panel when clicking on the checkmark to acknowledge the notification, a blue notification popup message was appearing in the lower right corner. This message was redundant and will no longer appear.

1.8.2

April 2025

Enhancements

Flowlink Cipher

Computed Datasets

The Computed Datasets functions "Data Points: Level to Flow Rate" and "Data Points: Level to Area" now allow the user to upload a comma separated text file with the data points to populate the table. The format of the file requires that the first line contains the Units abbreviations, followed by lines with the data point pairs separated by commas.

Dashboard

The Battery gadget will now display the battery bank currently in use based on the most recent History event for a battery change. The displayed voltages are provided by the Input Voltage quantity.

General Application

The site search fields have been improved with drop-down lists of available values when the search method is Tenant, Tag, Site name, etc... The default 'All' search method has not changed and will continue to allow the user to enter text to search for any of the fields.

Graphs

The Change Pane option in the graph properties dialog box now allows a quantity to be moved to another pane that already has the same quantity in the pane. This was not allowed previously. The graph system now supports multiple copies of the same quantity in the same pane.

Map

The Map Legend will now filter the list of sites in the Sites panel as well as the site icons on the map display.

Reports

The 'Report type' filter on the Reports > List screen now has 'Alarms report' as an option to filter the list of reports stored in the database.

Sites

Switching from the List View to the Grid View while sites were selected was leaving the five function buttons at the top of the list still enabled, however, the sites were not marked as selected in the Grid View. To avoid any unintended actions on selected sites, the five function buttons will now be disabled when the display is switched to Grid View. In Grid View the user can execute actions on one site at a time.


The Delete site function has been updated to display a list of the sites that have been selected for deletion. This is intended as a reminder to the user about how many and which sites will be permanently deleted when the function is executed.

User Accounts

A new option has been added to the General section of the Preferences tab in the User Profile screen, "Show inactive sites in search and site selection lists", which is off by default. When off, the inactive sites will not appear in the site selection lists. When on, the inactive sites will be available to select in the functions that can access an inactive site. This option does not change the behavior of the 'Show Inactive Sites' button on the Sites screen function bar which controls the display of inactive sites in the grid and list views on that screen.

Maintenance

Flowlink Cipher

Computed Datasets

Previously the Area Velocity function in Computed Datasets would sometimes return 'null' values when the Level measurements exceeded the function input parameter for Maximum Height. The function will now limit the measured Level values to the Maximum Height when applied to the formulas which will allow a computed value for Flow Rate to be returned from the function instead of a 'null' value.

Executing the "Compute dataset from site" function on a site card was opening the Compute Datasets screen with the site name duplicated in the 'Select a site' field. This has been fixed. The site name now appears once as expected.

Graphs

The Change Pane option in the graph properties dialog box was not visible when there was no other pane available or the same quantity was already assigned to the other panes. This has been fixed. The option will always be visible even if there is no other pane available.

Reports

Previously when the Pick Site function was used to start a new report from a report template, the units for the Volume statistic was not retrieved from the template. This was visible in Step 3 of the Reports wizard and if the user did not set the units, the Preview would fail with an error message. This has been fixed. Step 3 is now correctly retrieving the units for Volume from the template.

Templates

Saving a graph template now stores the Data Handling option in the template with the other properties for each quantity in the graph. Previously, the Data Handling option was not recorded in the graph template.

Tenants

System administrators were unable to move user accounts into a tenant if the maximum number of sites for the tenant had been reached. This has been fixed. There is no limit to the number of users that can be added to a tenant.

Deleting a tenant would sometimes fail when associated data elements remained in the database. Graphs, Graph Templates, Reports, Report Templates and Scheduled Jobs are all associated with the tenant that the site is in. The Delete Tenant function has been upgraded to warn the user that these associated elements will also be permanently deleted when the tenant is deleted. The sites and user accounts are moved to the Holding Tank. The System Administrator performing the deletion must enter the word "delete" in the confirmation box to complete the procedure.

User Accounts

The list of Data Types in the Preferences tab of the User Profile page is now sorted alphabetically. Previously, some of the newer Data Types were located at the bottom of the list. This has been fixed.

1.8.1

March 2025

Enhancements

Flowlink Cipher

Export

The Precision option in Sites > Export now includes the value zero. When set to zero, the exported values for the quantity will be integers.

The Sites > Export options now include the choice of exporting the original data values for each quantity or the edited values. This option is not available for computed datasets because computed datasets are always computed from the edited points of their source quantities.

Data Handling has been added to the site export options. Previously the Data Handling user preference was applied to each quantity to be exported as a global setting. The user can now select a different Data Handling option for each quantity included in the export. The user preference for Data Handling still provides the default value for each quantity to be included in the export.

Graphs

The Data Handling option on the graph view screen has been moved to the graph display properties dialog box. Previously, the Data Handling option was available only in the main graph screen with the user's preference providing the default value when a new graph was created. The user can now select a Data Handling option for each quantity in the graph. The user preference for Data Handling still provides the default value for each quantity added to a new graph.

The Save function in the graph Edit mode will now automatically update the display of the quantities in the graph. For example, if the graph contains a source quantity and a computed dataset created from the source, when the user edits points in the source and clicks Save, the display of the source quantity and the computed quantity will update automatically.

Reports

The Precision setting in Step 3 of the Report creation wizard now allows the value zero. When set to zero, the computed statistics will be displayed and output as integers.

Data Handling has been added to the statistics reports options. Previously the Data Handling user preference was applied to each quantity in the report as a global setting. The user can now select a different Data Handling option for each quantity in the report. The user preference for Data Handling still provides the default value for each quantity added to the report.

An Alarms type report can now be created in Flowlink Cipher. The report will tabulate all Data type events generated by one or more alarm settings within a defined relative or static time range. The report includes the event state, start time, end time, and duration.

Scheduler

The Scheduler now includes the new 'Alarms report' job type. To create the job select a job name, the job type, the job names options, and then select an Alarms report template that was created in the Reports wizard.

User Accounts

The user preferences for the Rainfall data type now include an option for 'Inverted'. Adding Rainfall data to a graph has always set the display property Inverted to ON by default. Now the user can control the default for this option if it is preferred that Rainfall data is not inverted.

Maintenance

Flowlink Cipher

Computed Datasets

The computed dataset functions "Data Points: Level to Flow Rate" and "Data Points: Level to Area" require the user to input a table of values that describe the model to be used to calculate Flow Rate. In both cases the table was not correctly applying the unit conversions to the input units defined by the user. This has been fixed.

The Flow Rate Calculation function for "Area Velocity" requires the input of a Level dataset and a Velocity dataset as parameters. When viewing the properties of the resulting Area Velocity computed dataset, via a site selection data tree, the Level Dataset and Velocity Dataset properties were both displaying the input Level quantity name. This has been fixed. The Velocity Dataset property now correctly displays the name of the input Velocity quantity used in the function.

A computed dataset created with the Area Velocity function was causing all of the quantities in a graph to not display when some specific time ranges were set for the graph. The problem was traced to some periods of recorded data for Level where the values were so large that the Area Velocity function was not able to return a number value. The recorded Level values were more than 10x larger than the Level Maximum Value parameter for the Area Velocity function. This graph display problem has been fixed by returning a null value instead of a failed graph display. The result is a gap in the computed Flow Rate data.

Map

Previously, adding coordinates to a site by clicking a location in the Map screen required the web browser to be reloaded in order for the Map legend to work correctly. This has been fixed and the legend can now be used to turn groups of sites on/off without having to reload the web browser.

Reports

In step 3 of the Reports wizard, the statistics for each quantity are selected for the report. In some cases the device name below the site name was incorrectly displayed as 'computed'. This has been fixed. The device name will now match what is visible in the devices panel of the site information screen.

A statistics report defined with a relative time range and a statistics interval of 'Month' will now compile the statistics based on calendar months beginning with the first day of the month and ending with the last day of the month. Previously the start of the month was tied to the user's preference for start of the week. This has been fixed.

Scheduler

Previously if the user defined a preference for sites with a Tag and a graph was created with one of the sites assigned that tag, when an Analysis job in the Scheduler was created with that graph, the list of scheduled jobs would exclude the job with that site. This has been fixed.

Sites

The 'Data Last Received' information in the General tab of the site information page was not loading correctly if the page was opened from the 'Go to site' function in the See Notifications panel. This has been fixed.

1.8.0

February 2025

Enhancements

Flowlink Cipher

Alarms

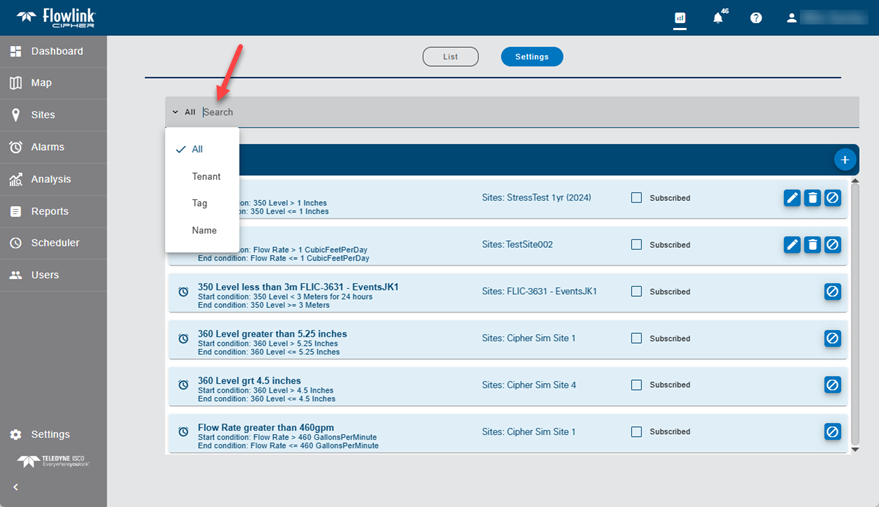
The Search field on the Alarms > Settings screen has been updated. Search options include All, Tenant, Tag, and Name. The search will filter the list of alarm settings.

Dashboard

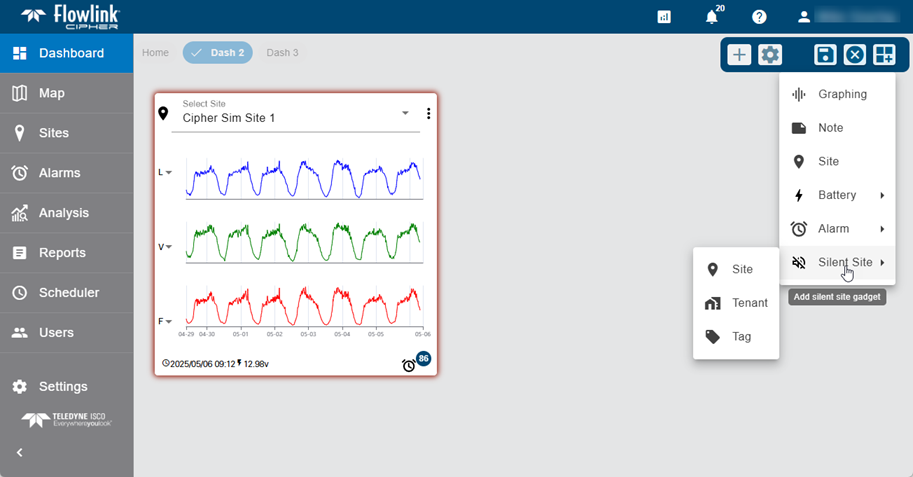
A Search field has been added to the Sites gadget on the Dashboard. Search options include All, Tenant, Tag, and Name.
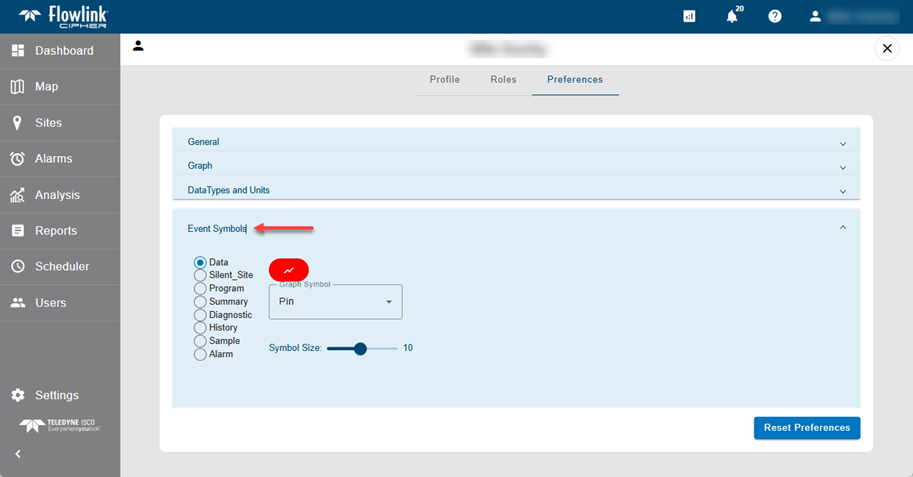
Graphs

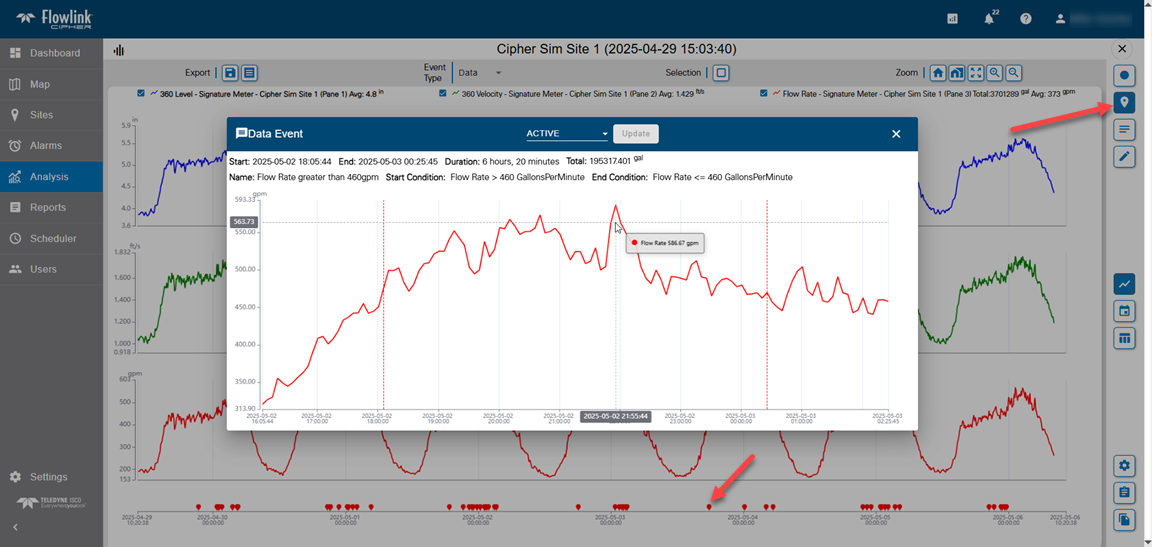
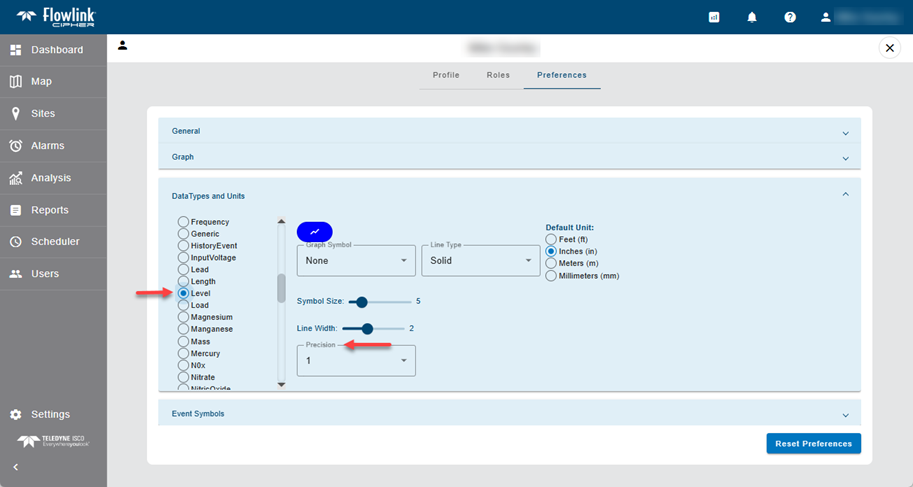
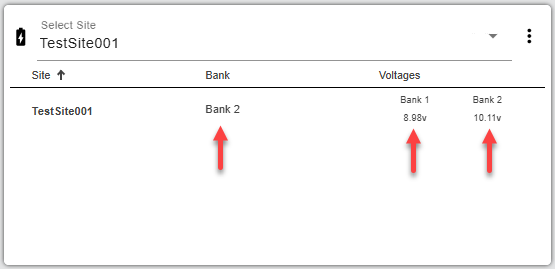
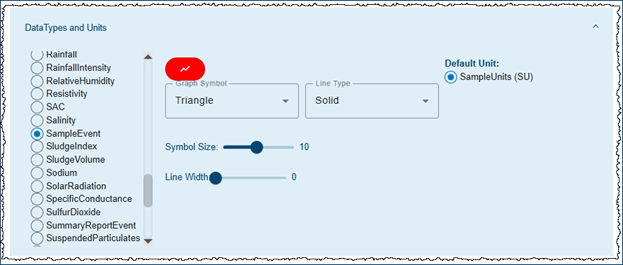
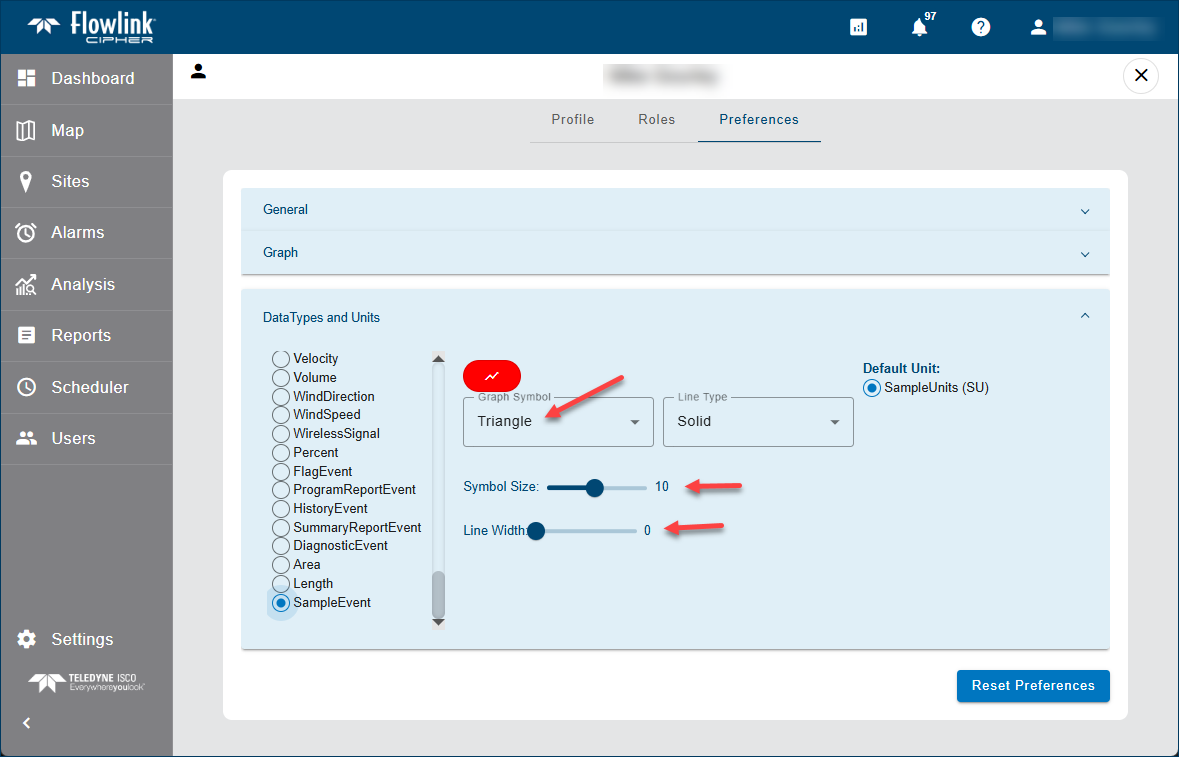
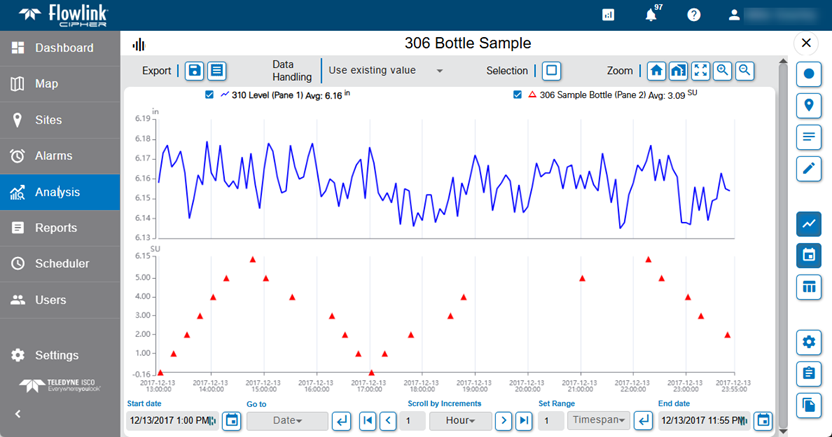
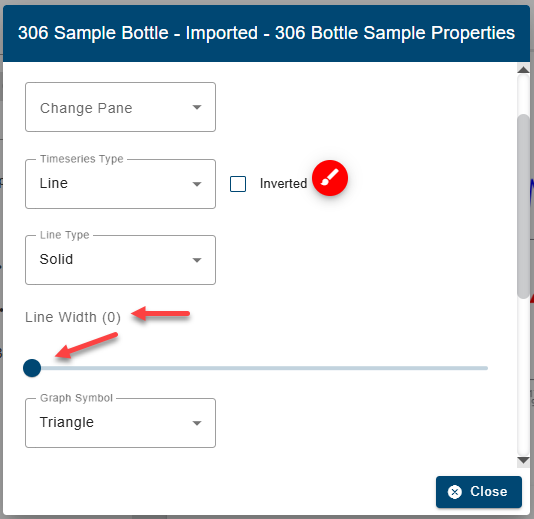
The default user preferences for the SampleEvent data type have been changed to triangle symbols with symbol size 10 and zero line width. These defaults will apply automatically only to new user accounts. Existing user accounts can set these preferences manually or use the Reset Preferences function to apply the new default preferences. The SampleEvent data type is used by 306 Bottle Sample quantities. The new preferences result in red triangles displayed in the graph without lines joining the symbols.

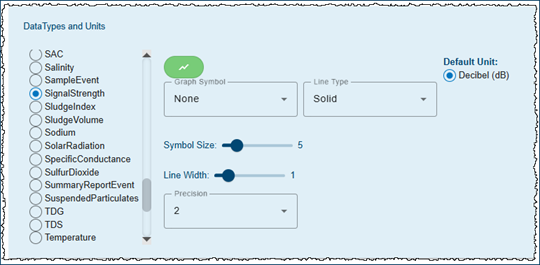
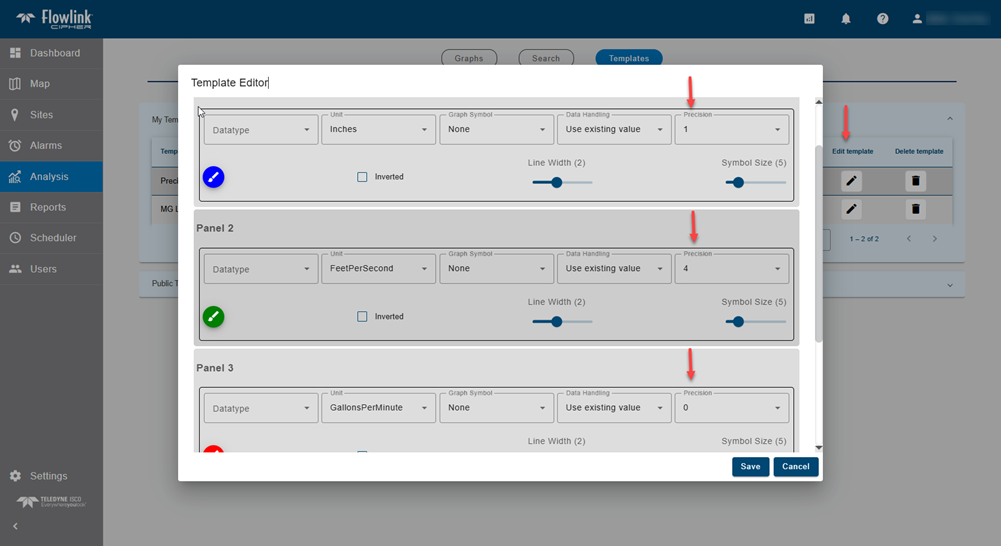
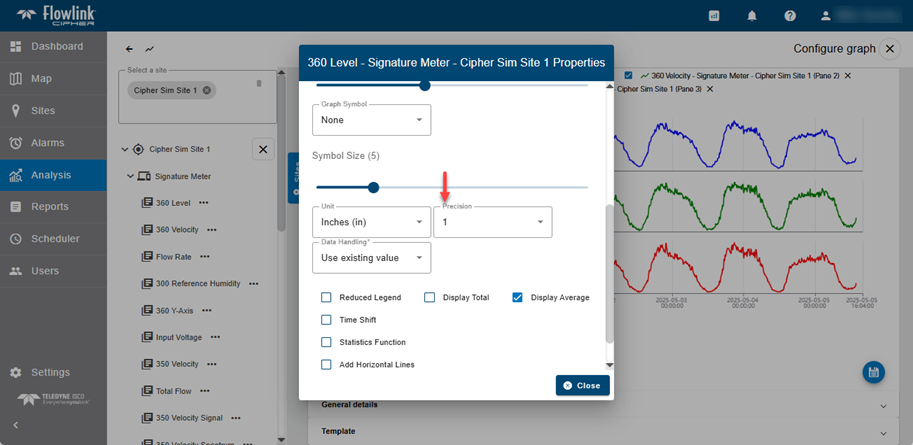
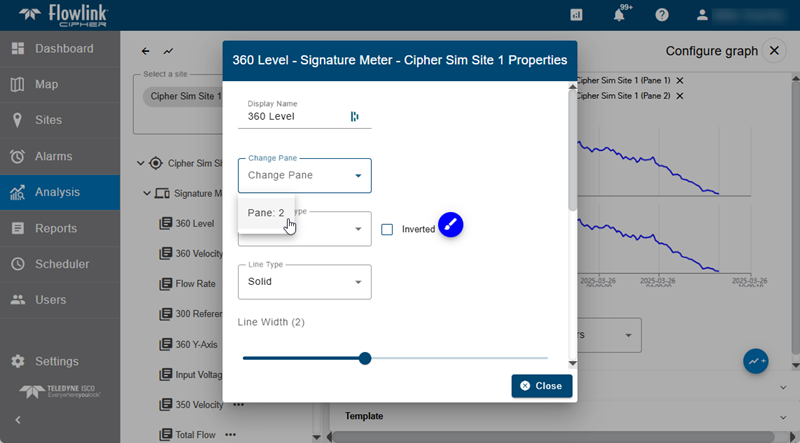
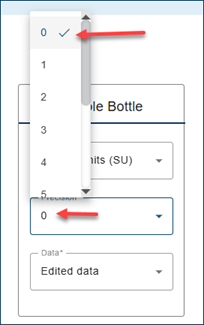
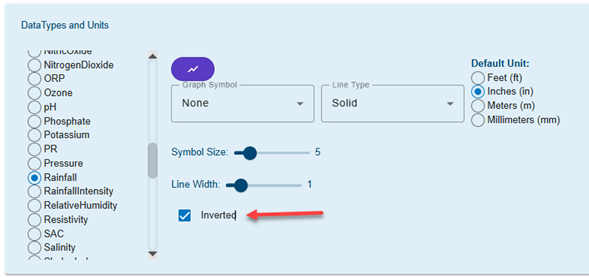
The minimum value possible for the Line Width in the display properties is now zero. When set to zero, the line that joins the point symbols is not displayed. This is useful if a quantity is to be displayed with symbols only.

Map

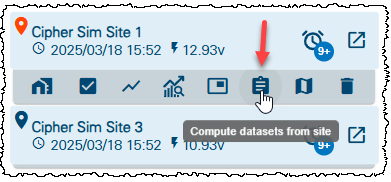
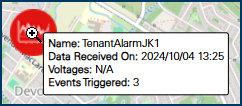
A tooltip will now display when the cursor is hovered over the icons on the Map screen.

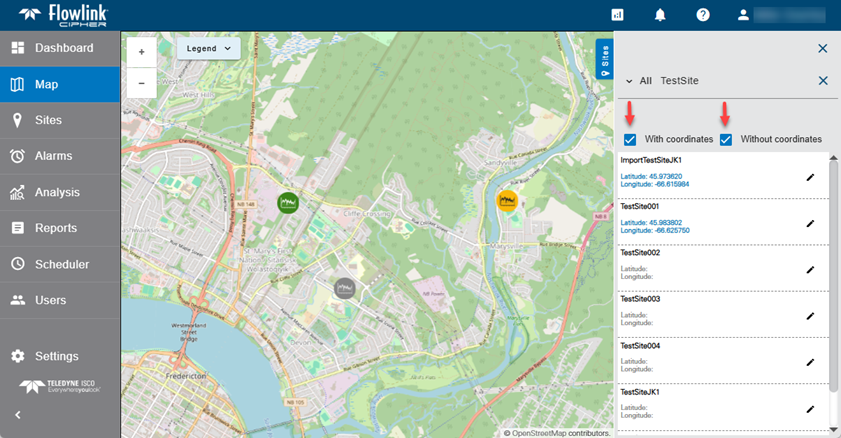
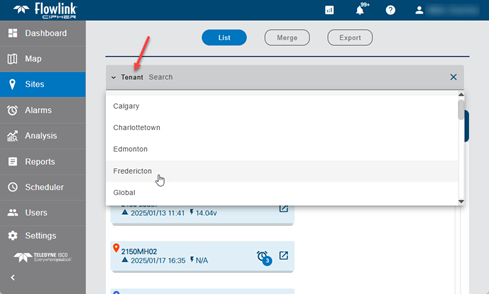
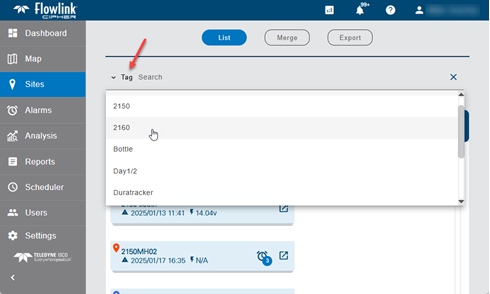
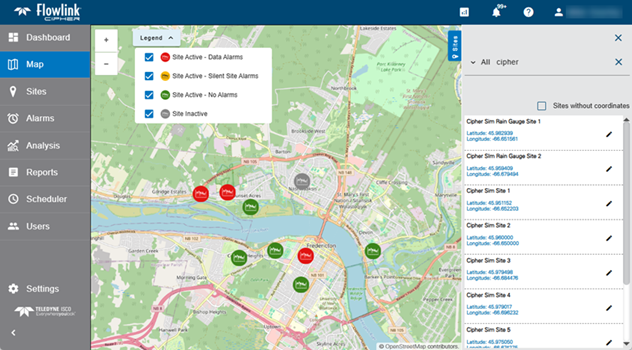
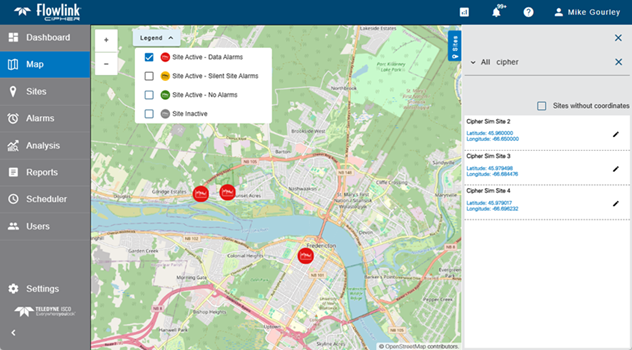
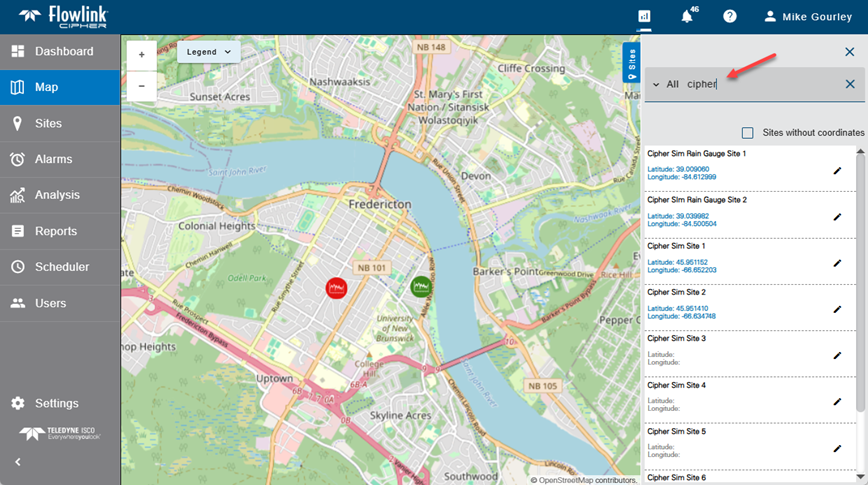
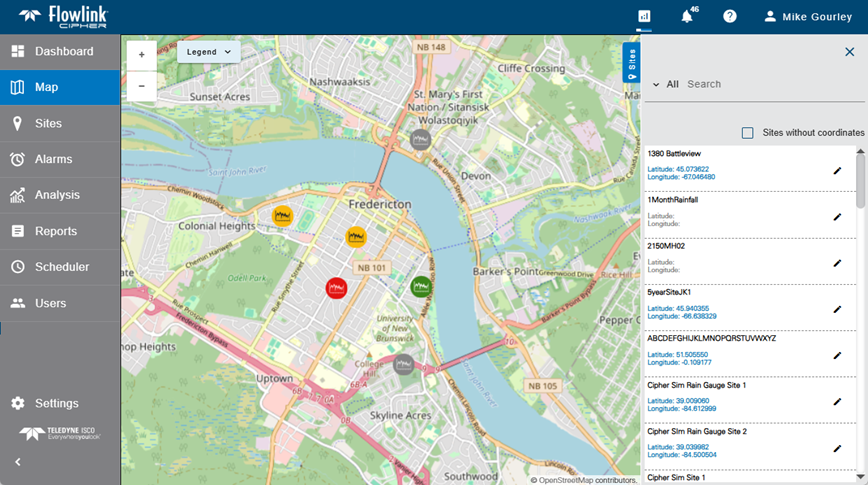
A Search field has been added to the Sites panel on the Map screen. Search options include All, Tenant, Tag, and Name. The search will filter the list of sites in the Sites panel according to the option selected. The site icons displayed on the map are also filtered by the search result. Examples are shown below of the map with and without a search.

The Map Legend has been updated to include on/off options for each of the four site status colors.

Notifications

The 'Notify when a new site is added' control has been moved from the blue function bar on the Site List screen to the user Profile screen.

Reports

Recent intermittent problems with empty results returned from the Reports and Scheduler functions have been resolved. Previously the report statistics were compiled by a backend service that was unreliable. The report statistics are now compiled in the business layer of the application, which is expected to provide results without the intermittent empty tables.

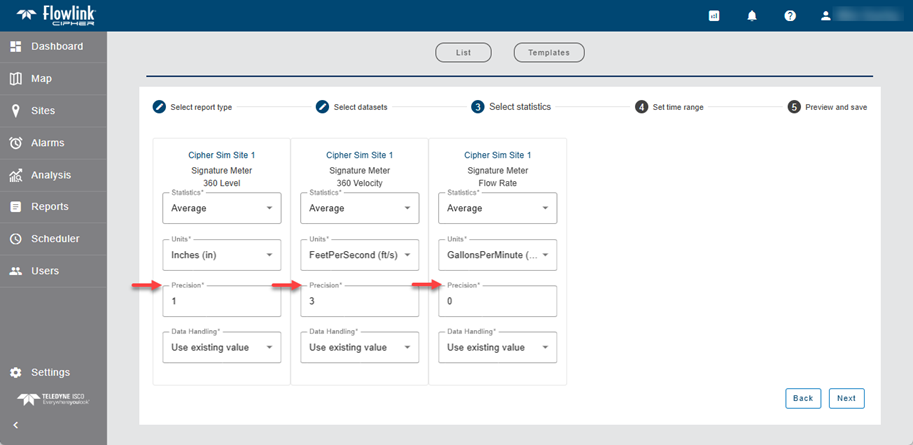
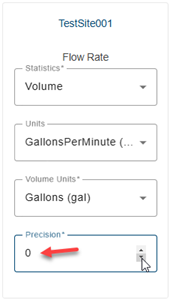
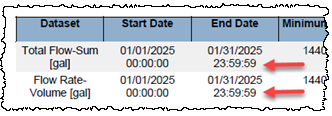
Cipher computes Volume statistics from Flow Rate for each data point using the time difference from the previous data point. Previously this meant that the first point in the dataset would not have a Volume computed to contribute to the total volume for the daily interval period. This has been fixed by assuming that the time interval to use for the 1st point is the same time interval as between the 1st and 2nd points which is used to calculate the Volume for the 2nd point.

The previously named "Basic health report" has been renamed as the "Health report".

Monthly statistics generated by the Reports and Scheduler functions are now based on calendar months, as expected. Previously, the interval option for "Month" would generate statistics for 30 day time periods that were not aligned with calendar months.

Scheduler

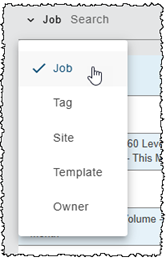
The Scheduler screen now has a Search field to help find the desired scheduled job. Search options include: Job, Tag, Site, Template, Owner.

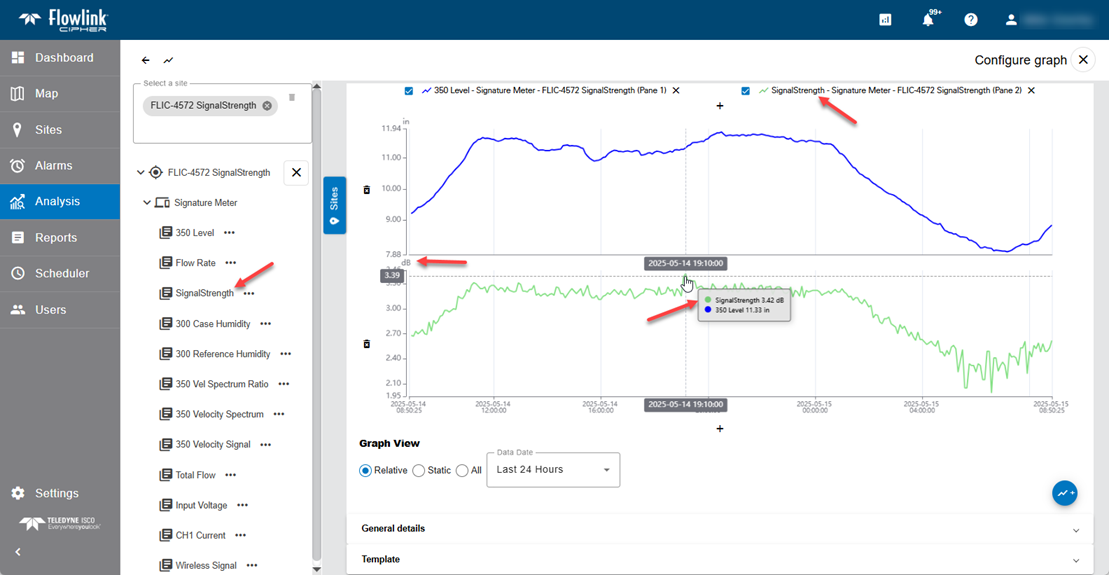
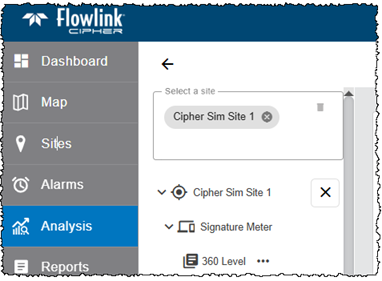
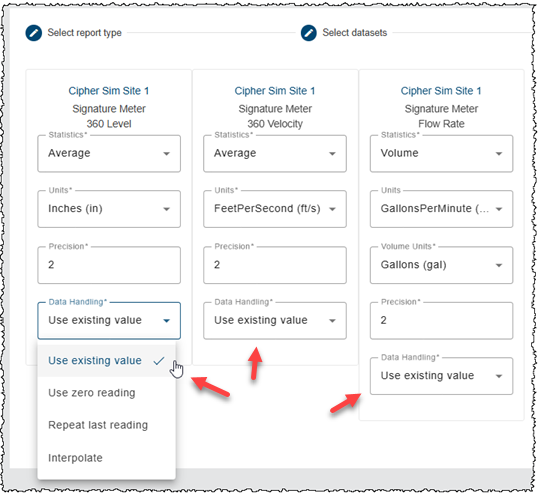
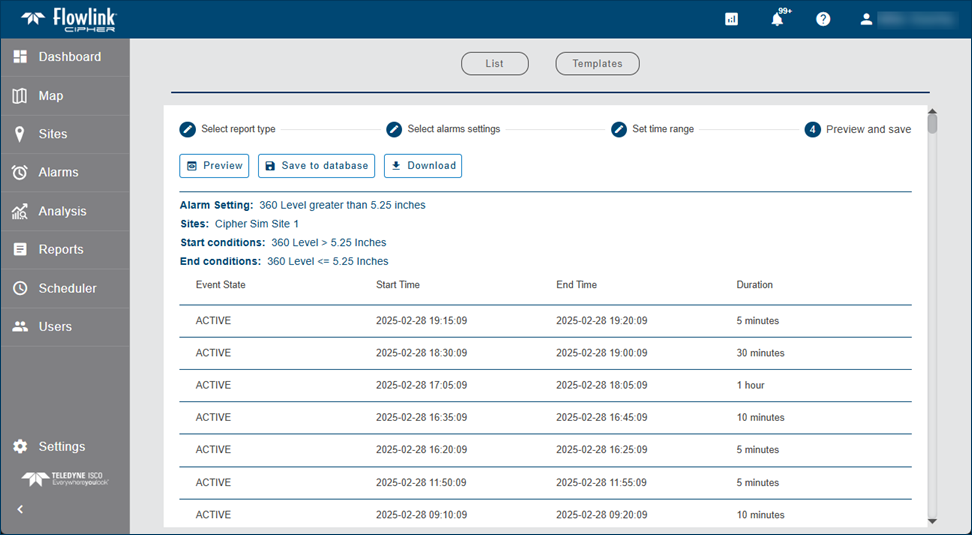
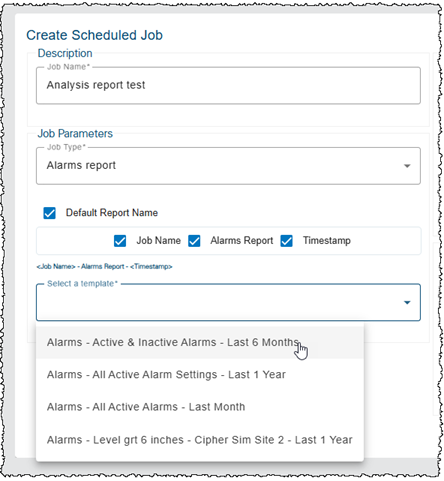
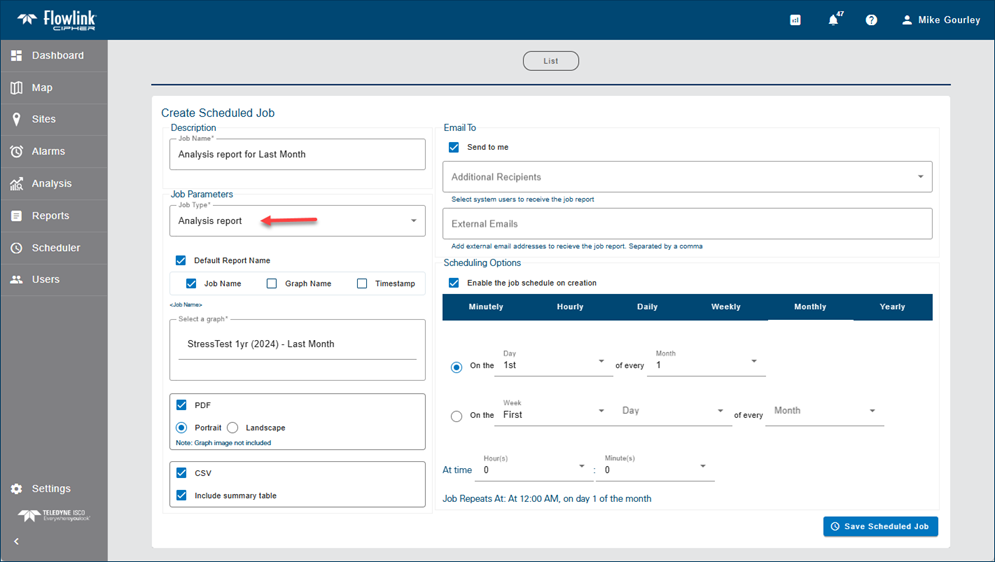
A new type of report has been added to the Scheduler. The Analysis Report will generate a PDF and/or CSV output of the most up to date data contained in a private or public graph. Note that an image of the graph cannot be included in the PDF output option.

Sites

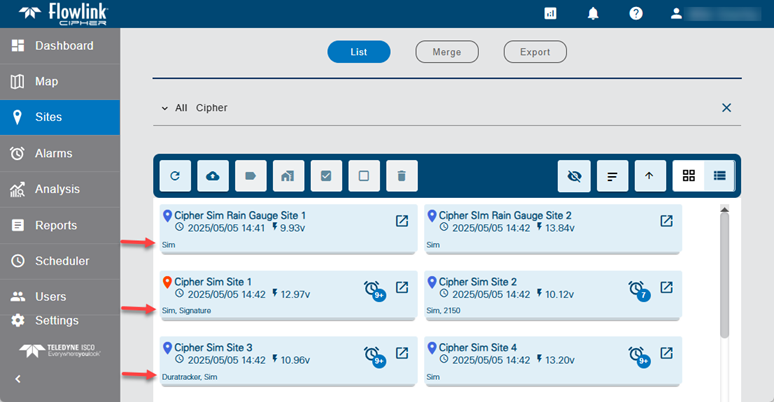
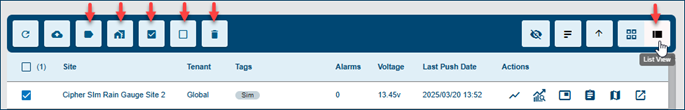
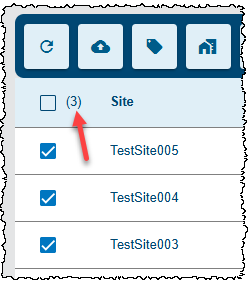
The new List View in the Sites screen includes a count of the number of sites selected in the List View table.

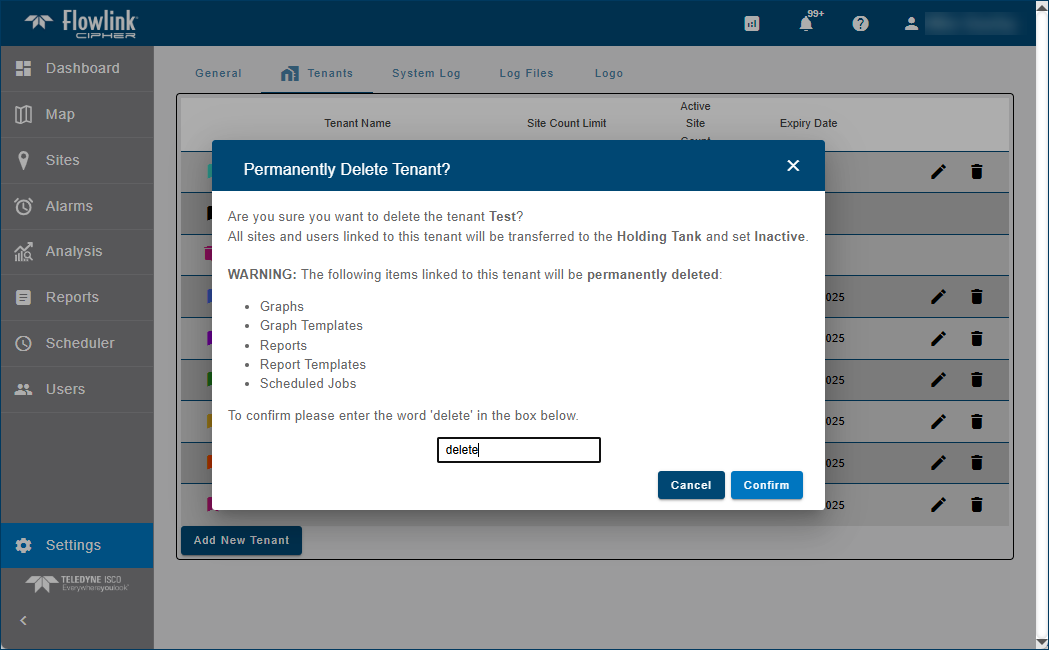
The procedure for deleting sites has been strengthened because multiple sites can now be deleted at the same time using the new List View. The Delete site confirmation message now requires the user to manually enter the word 'delete' into the text box before the Delete function button is enabled. The word 'delete' is not case sensitive. The confirmation message also includes the number of sites to be deleted to help confirm the correct sites are selected for deletion.
REMINDER: DELETED SITES CANNOT BE RECOVERED.

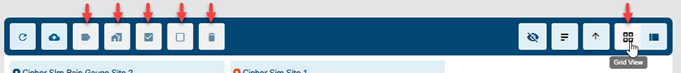
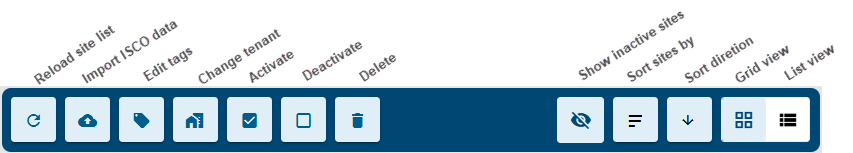
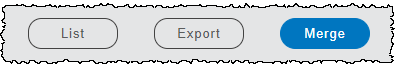
The blue toolbar on the Sites screen has been updated with new tools and a new arrangement of the existing toolbar buttons, as follows:

The Merge function has been moved from the blue function bar on the Sites List screen to a new Merge tab on the Sites screen.

In the new Sites screen List View, when Inactive sites are enabled for display, the row in the table is displayed with a transparent blue color.

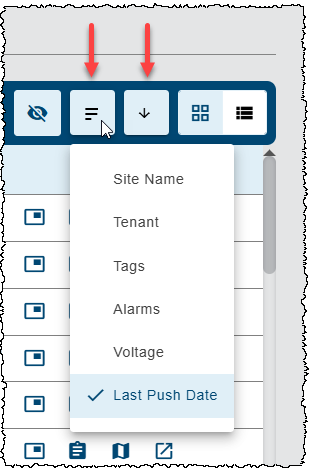
The updated Sites screen now has 'Sort sites by' and 'Sort' direction controls in separate buttons on the right side of the blue function bar.

Tags

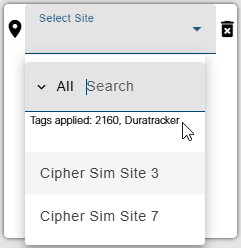
In several locations in Cipher where the user will select one or more sites from a site list, a message is now displayed reminding the user of the Tags they selected in their user preferences.

A new toggle has been added to the Sites List screen to temporarily disable the user preferred tags, which will allow the other sites to appear in the Grid and List views. This temporary display allows a user to apply the preferred tag to additional sites and then re-enable the tags using the toggle. This avoids having to remove and re-add the tags in the Preferences tab of the User Profile screen each time tags need to be added to additional sites.

The Preferences tab of the user Profile page now contains a field for the user to select one or more of the existing Tags as their preferred tags. The preferred tags are then used to help the user find their preferred sites in many functions throughout Flowlink Cipher.

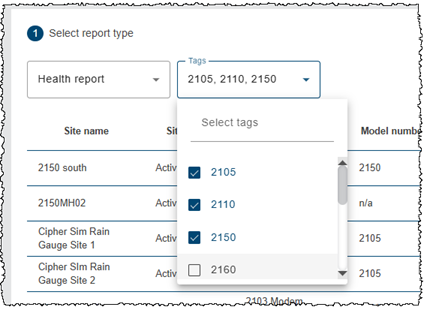
The Health report option in the Reports wizard now includes a field to select one or more Tags to control the list of sites to be included in the Health report. By default the user's preferences for Tags will be selected in the field. The user may then change the Tags selection to change which sites are included in the Health report.

The Site search field in the Reports > List table now includes an option to search for reports using a Tag.

The Site search field in the Alarms List screen now includes an option to search for sites using a Tag.

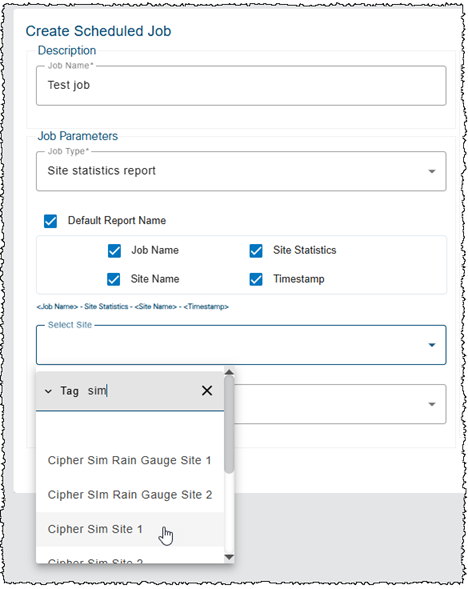
The Create Scheduled Job screen has been updated with new search options for selecting a site, including searching with a Tag.

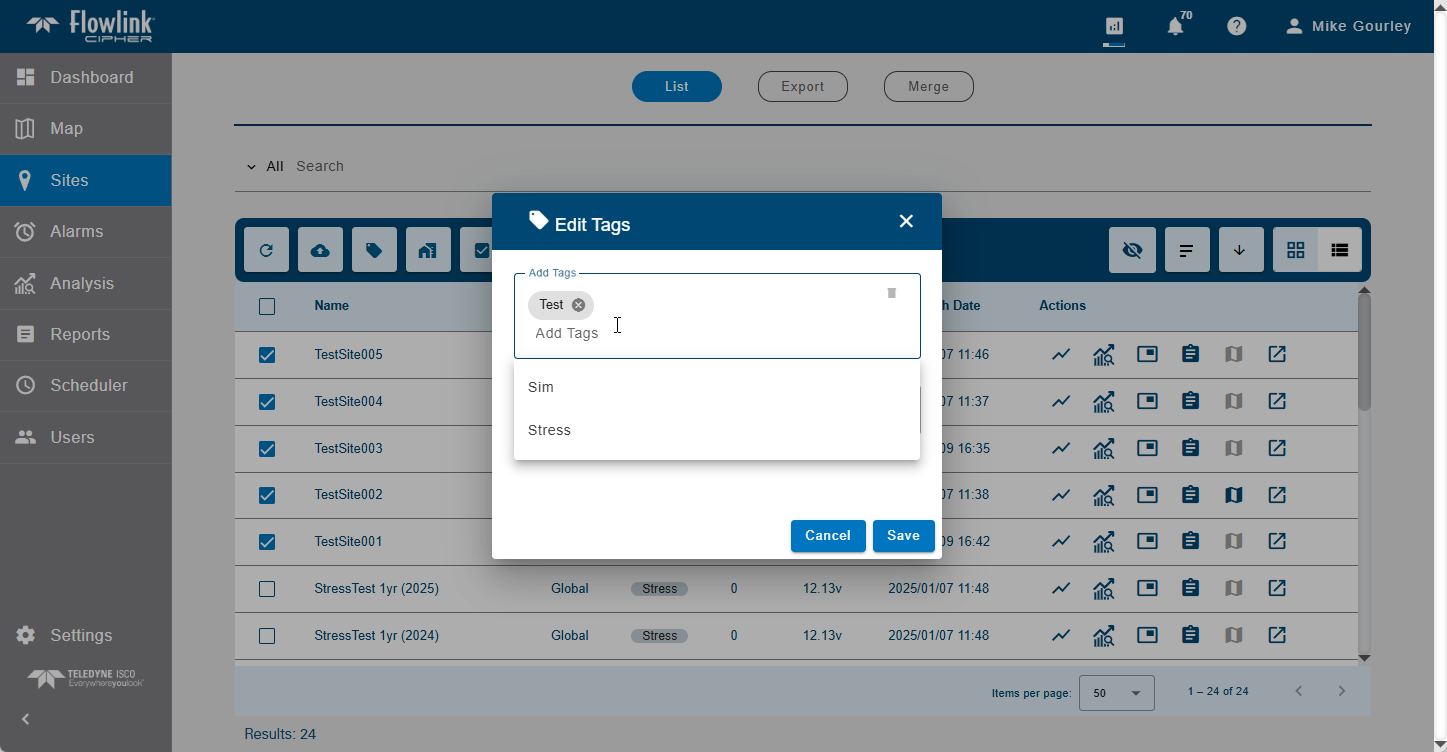
A new site Tag system has been implemented to replace the previous site Group system. The site Tag system allows one or more Tags to be attached to each site and then various site lists can be filtered based on the Tags. The site Groups have been removed. The previous Group names will become Tags with the release of Flowlink Cipher 1.8.0.

Maintenance

Flowlink Cipher

Computed Datasets

Editing an "I and I" computed dataset was affecting the "DryFlow" type computed dataset attached to the "I and I" computed dataset, leaving both datasets in an unusable state. This has been fixed.

General Application

The sort order of computed datasets was not consistent in the data tree that appears in multiple screens. This has been fixed. The Computed Datasets branch of the data tree will now show the names of the datasets sorted alphabetically.

Multiple types of computed datasets did not display a value for the "Function" property when the Properties dialog box was displayed for a dataset. The "Function" property is now recorded when a computed dataset is created and the Properties dialog box now displays the computed dataset function that was used to create the dataset.

Graphs

The 'Save as graph' function in the main graph screen was not generating a copy of the graph but instead was just renaming the graph. This has been fixed. The function now opens a new graph in the Configure graph screen with the user defined graph name. Click the 'Create graph' button and a new graph is created while the original graph remains.

Reports

The End Date in the summary table of the output from Reports has been updated to correctly indicate the full time period of the report. Previously, for report time ranges that were based on full days, the End Date time was displayed as 00:00:00. These time ranges include all of the last full day, therefore the End Date time is now displayed as 23:59:59.

Reports generated for the period of December 2024 were incorrectly displaying the year 2025 in the 'Minimum Value Time' and 'Maximum Value Time' columns for the last 3 days of December; 29, 30, 31. This was caused by incorrect formatting for year of the week instead of calendar year. This has been fixed.

When generating a report where the defined time range would include empty rows in the table, the summary table at the end of the report would have incorrect timestamps for 'Minimum Value Time' and 'Maximum Value Time'. The incorrect timestamps would display as 01/01/1970 00:00:00. This has been fixed.

The 'Clear all filters' function on the Reports > List screen was changing the current sort column and sort direction of the table. This has been fixed; clearing the filter no longer changes the sort order.

The 'Last battery voltage' values that appeared in the Health report were including all significant digits. The format of the column has been changed to limit the values to two significant digits to the right of the decimal point.

The filtering options on the Reports > List table were not working as expected when multiple filter fields were combined together. This has been fixed. Multiple fields can now be combined to filter the table of stored reports.

The output from site statistics reports was showing 'Invalid date' in the maximum and minimum time value columns if there was no data for the interval specified. The time columns now display a dash '-' to indicate an empty result as is done for the maximum and minimum value columns.