Alarms |
| Previously when an alarm setting was defined with a computed dataset, the alarm setting panel would not display the start and end conditions of the setting. This has been fixed. |
Dashboard |
| The 'Dashboard Configuration' dialog box now displays the 'Created Date' of the dashboard. Previously the date was missing for some dashboards. |
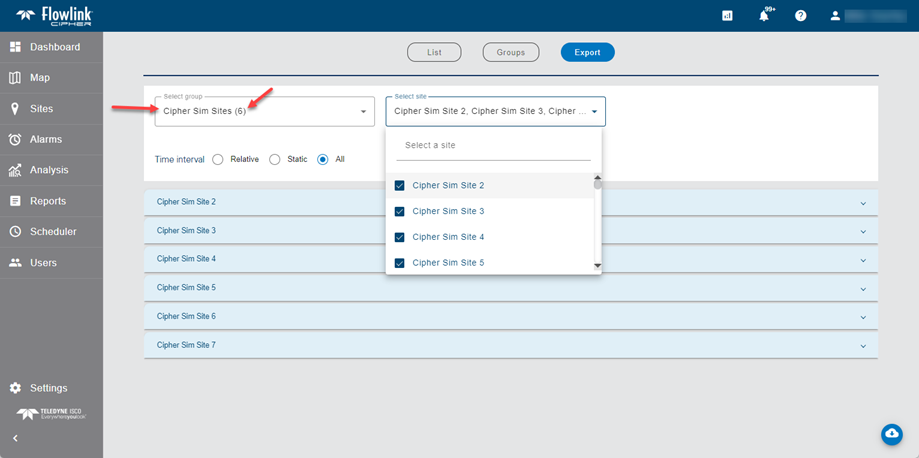
Export |
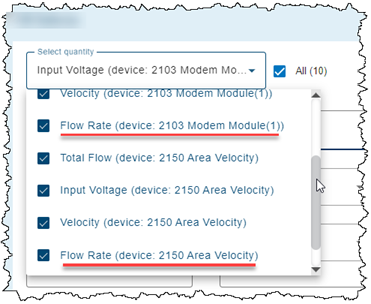
| The Sites > Export screen has an expanding panel for each site to be exported. In the expanding panel for each site is a checkbox option to export "All" quantities. The number in parentheses next to "All" now correctly displays the total count of the quantities that are available in the site for export. Previously, the count number was always zero. |
General Application |
| For some users with large numbers of sites and active ingestion of new data into the sites, the previous release experienced unnecessary memory usage in the browser which caused the browser to stop responding and require a restart. This has been fixed. |
Graphs |
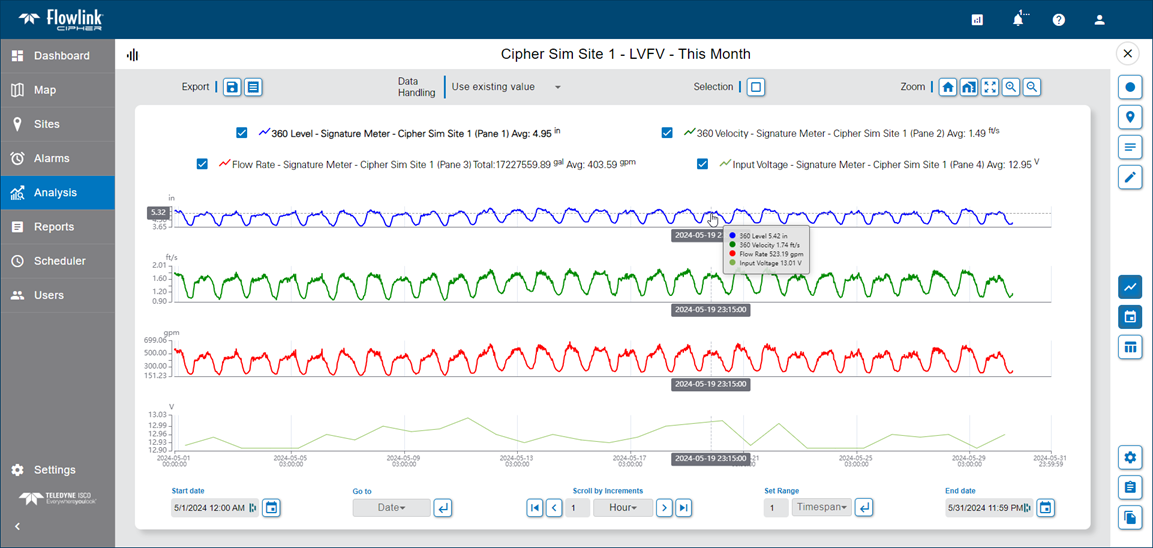
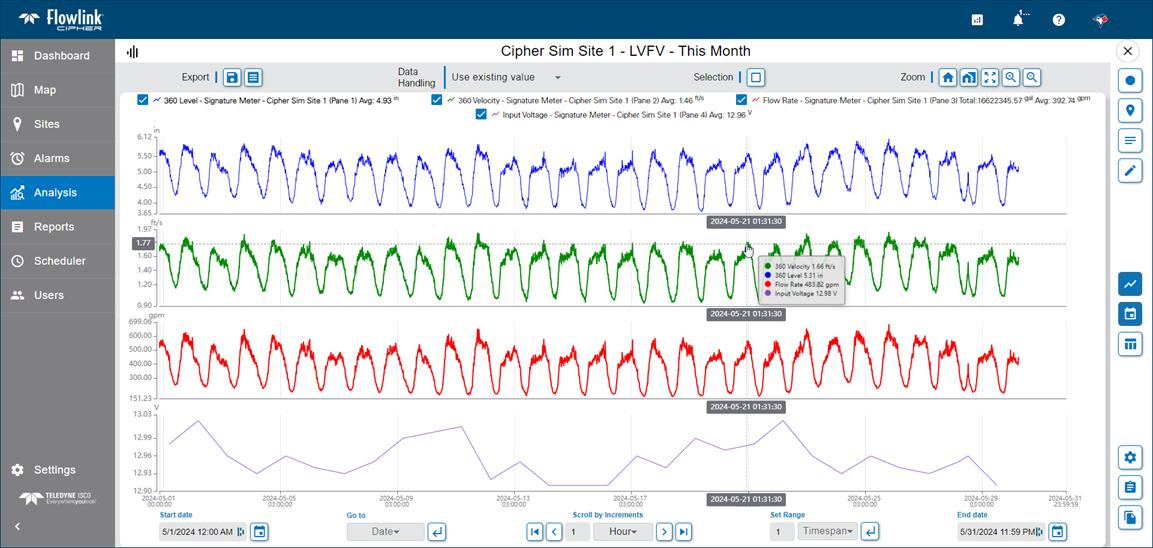
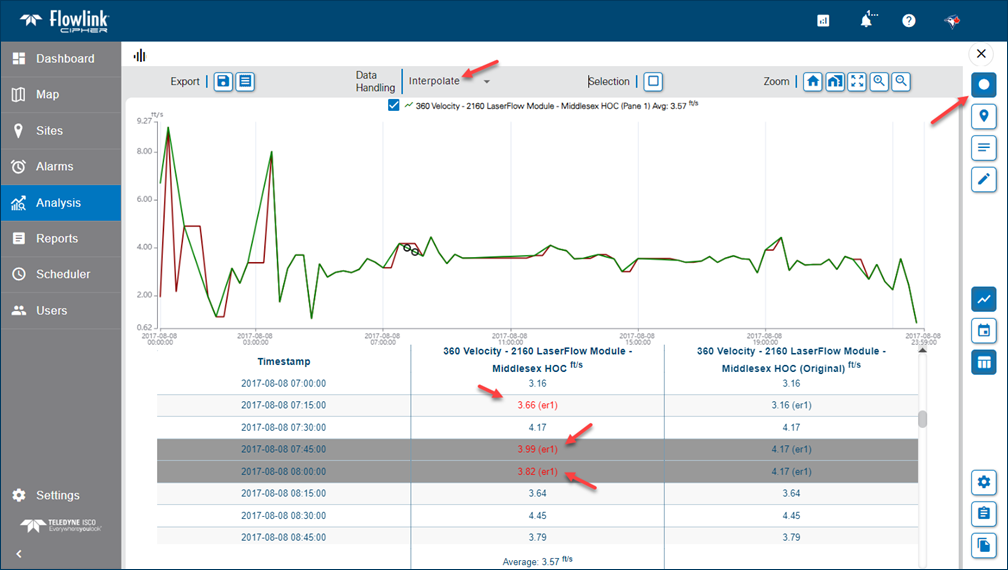
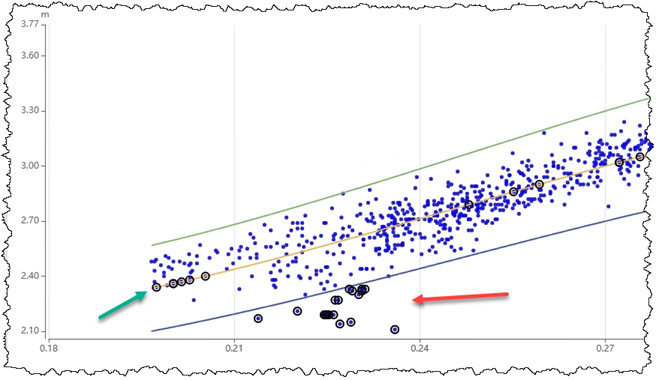
| When selecting points in the main graph screen, as each new selection is made on the same quantity in the graph, the previously selected points are no longer marked with the circle. However, if the user switches the selection mode to another quantity in the same graph and begins selecting points in the second quantity, the previously selected points in the first quantity were still marked with the circle. This was incorrect and has been fixed. |
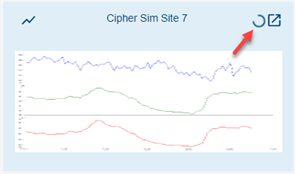
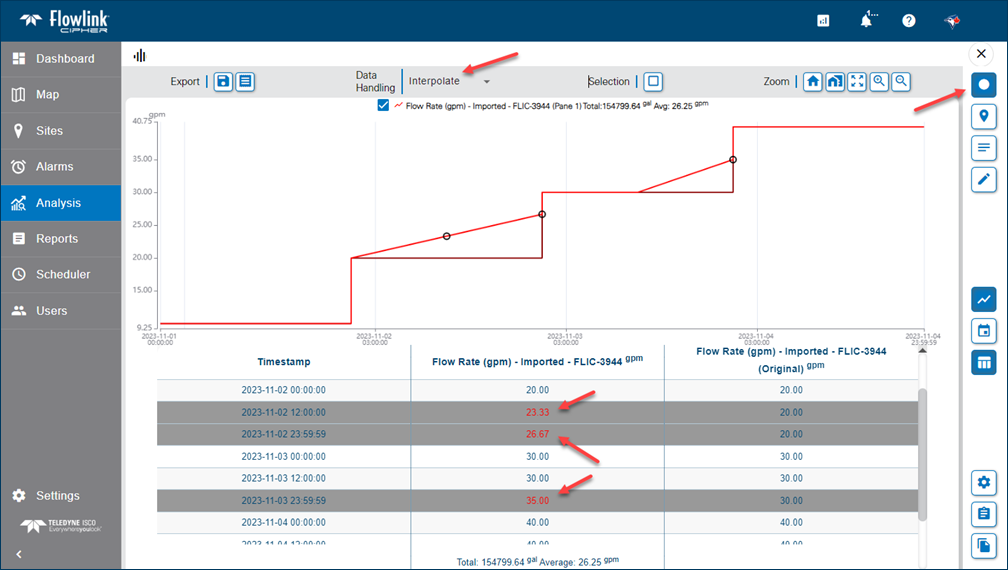
| The "Toggle original data" and "Restore original data" functions in the main graph screen are now working as expected. The "Toggle original data" function is now correctly displaying the time series graph through the original point values in a dark red color. The "Restore original data" function now correctly restores a selection of previously edited points to their original values. |
User Accounts |
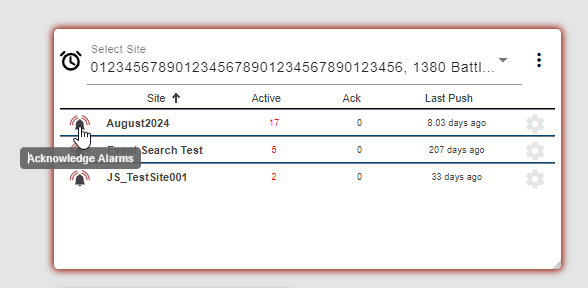
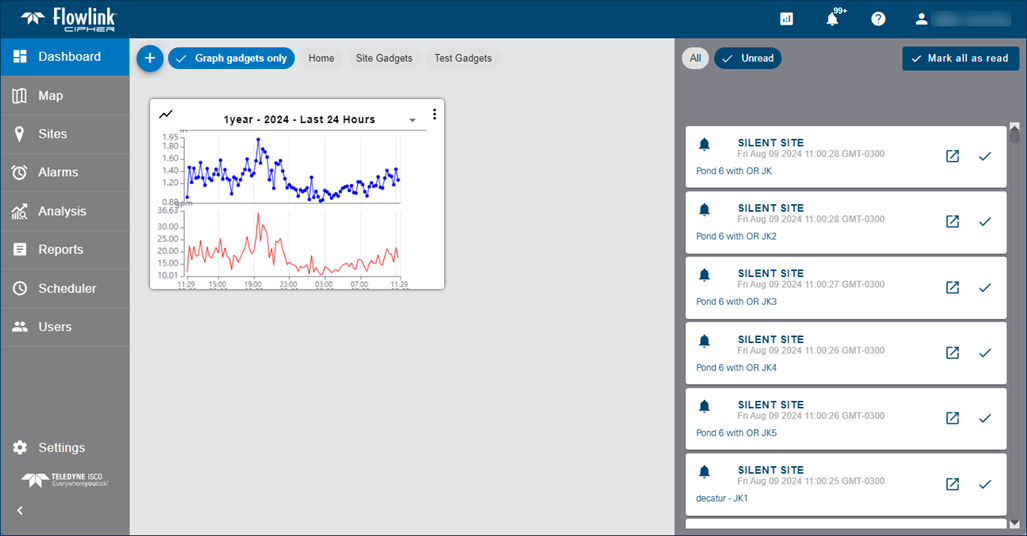
| The Viewer role does not have permission to edit the status of Data events. Users with the Viewer role will no longer see the control to change the status of Data events in the events list tables. The buttons to change the status of alarm events on the Alarms gadget will still be visible to Viewer users, but will be disabled. |
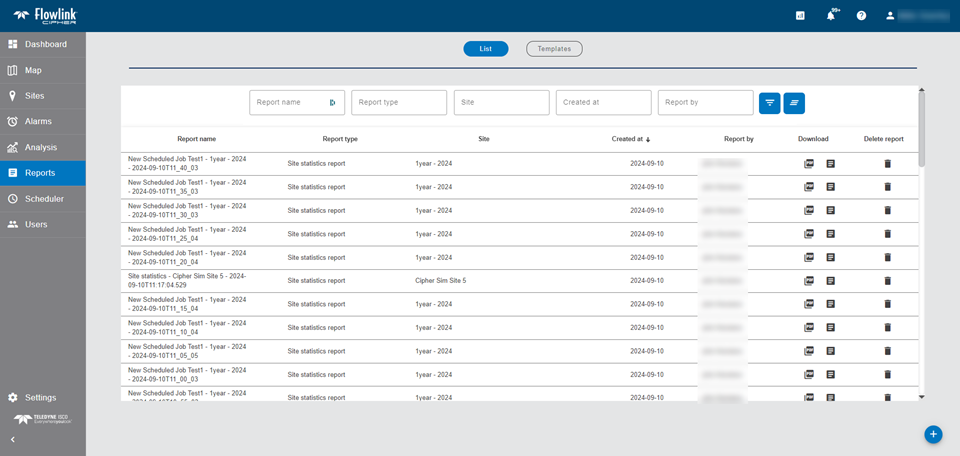
| The System Administrator role does not have permission to generate Reports, therefore the Reports menu item in the left sidebar is no longer visible for users with the System Administrator role. |
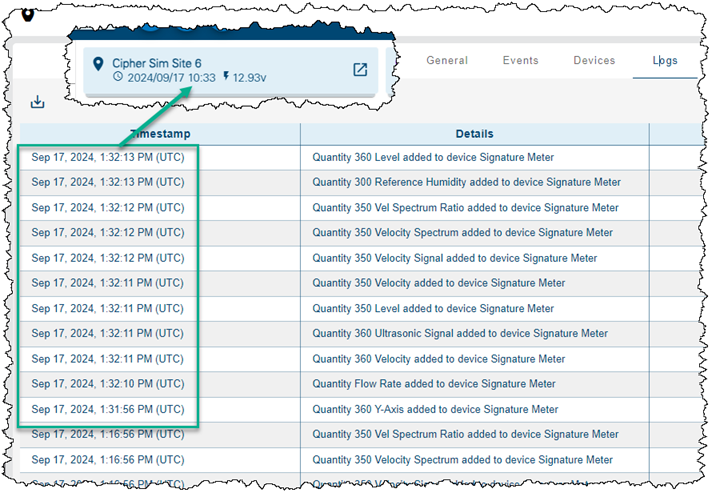
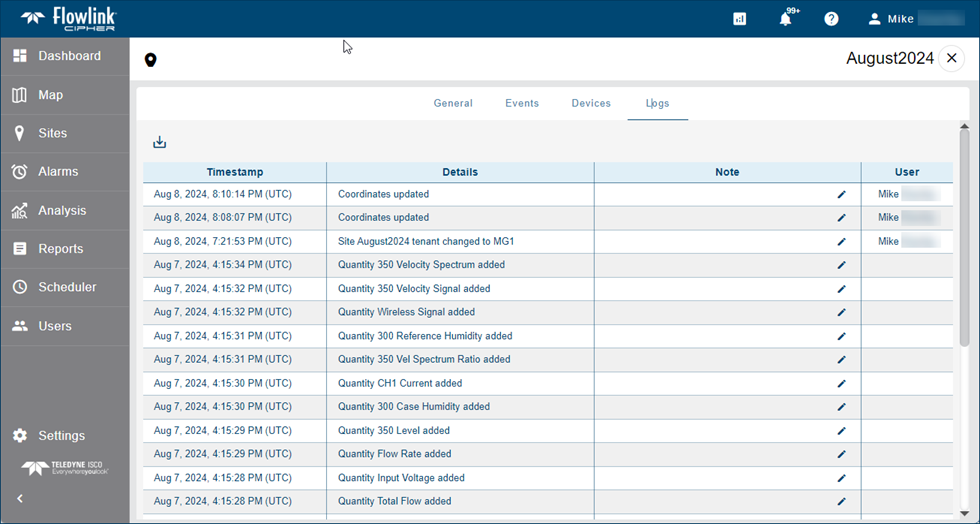
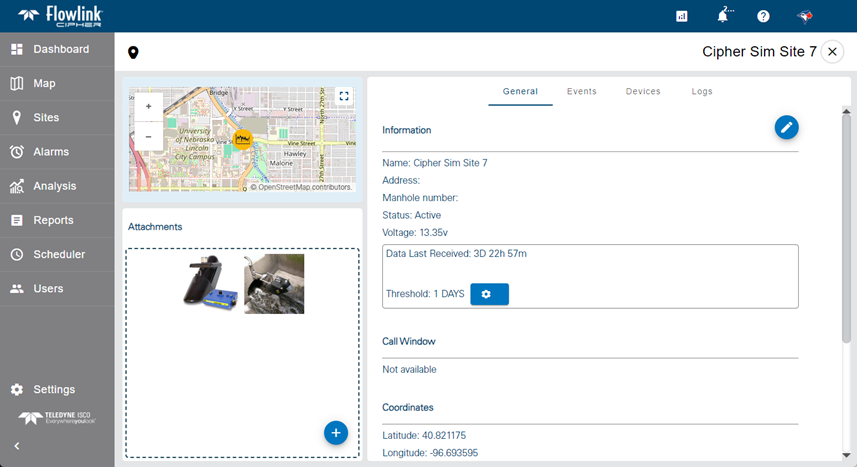
| The System Administrator role does not have permission to view the Logs information for a site, therefore the Logs tab is no longer visible in the site information screen for users with the System Administrator role. |
| Users with the Administrator role were not able to create a new Data event in the Analysis > Search function. Also, the Administrator role could not be used to modify the status (Active, Acknowledged, Resolved) of a Data event. This is been fixed; users with the Administrator role can now create and modify Data events. |
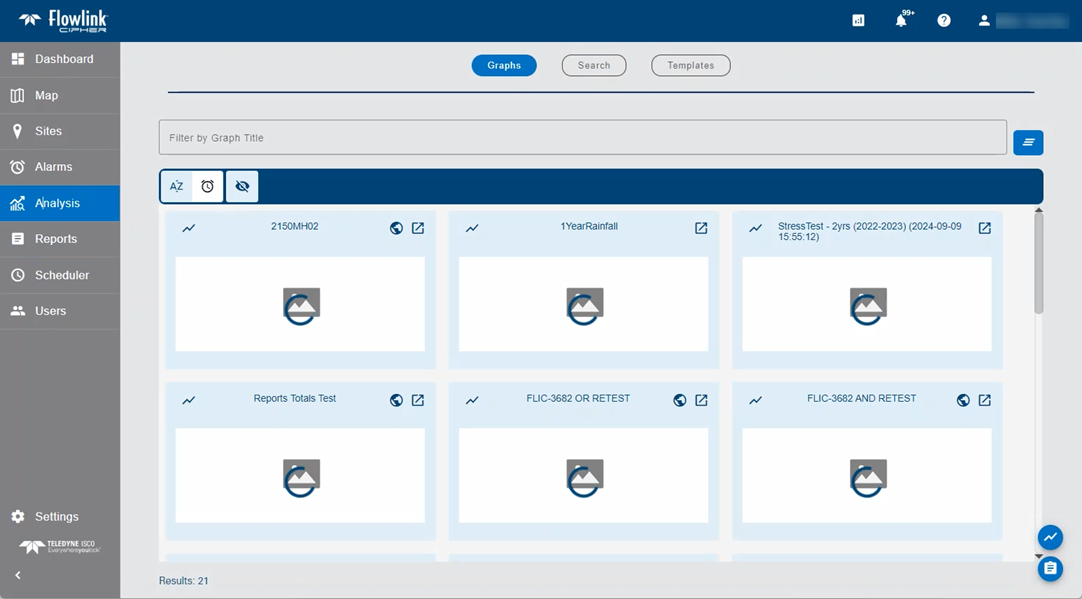
| The Viewer and Site Manager roles do not have permission to edit graphs, however, the Edit Graph button in the bottom-right corner of the main graph screen was visible to users with these roles, but not operational. This has been fixed and the button is no longer visible to when logged in with the Viewer and Site Manager roles. |
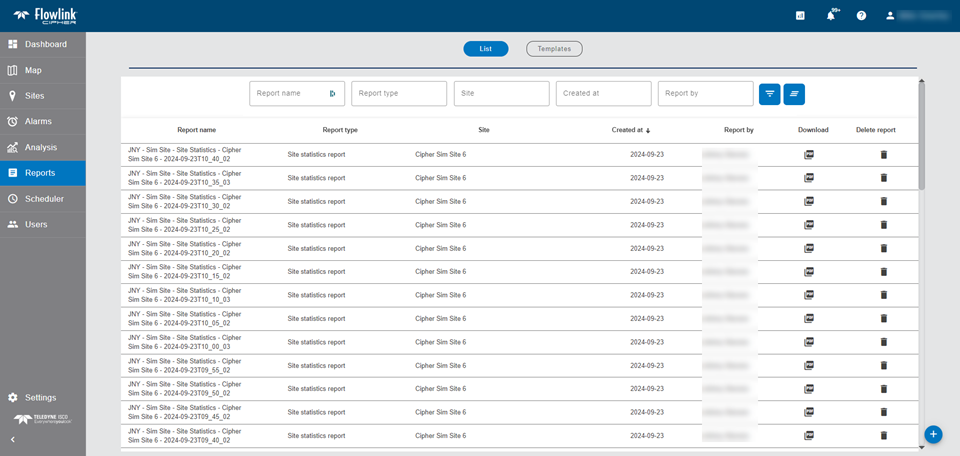
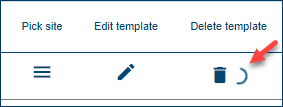
| The Viewer role does not have permission to create, edit or use a Reports template. The Reports > Templates tab is no longer visible to users with the Viewer role. |
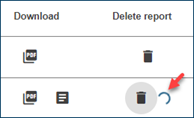
| The Viewer role does not have permission to edit or delete graphs. Previously the Edit Graph and Delete Graph buttons on the graph tiles of the Analysis screen were visible to users with this role, but not operational. The buttons are no longer visible to users with the Viewer role. |
| The System Administrator role does not have permission to use the following functions on the Devices panel of a site information screen:
- deleting a device
- editing a device name
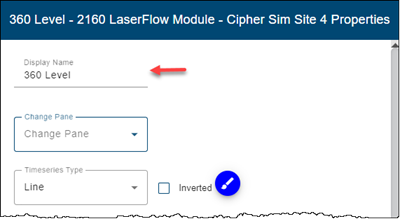
- displaying device properties
- deleting a dataset
Previously the buttons were visible for these functions, but were not operational. This has been fixed and the buttons are no longer visible for users with the System Administrator role. These functions are permitted for the Site Manager and Administrator roles. |
| The "Delete site" function on a site card on the Sites List screen is no longer visible to users with only the System Administrator role because this role does not have permission to delete sites. Previously the button was visible but not operational. The function is permitted for the Site Manager and Administrator roles. |
| The function to add a Site gadget to the Dashboard is no longer visible to users with only the System Administrator role because this role does not have permission to use the Site gadget. Previously the function button was visible and a site gadget could be added to the Dashboard, but the data would not load for users with this role. All other roles have permission to use the Site gadget. |
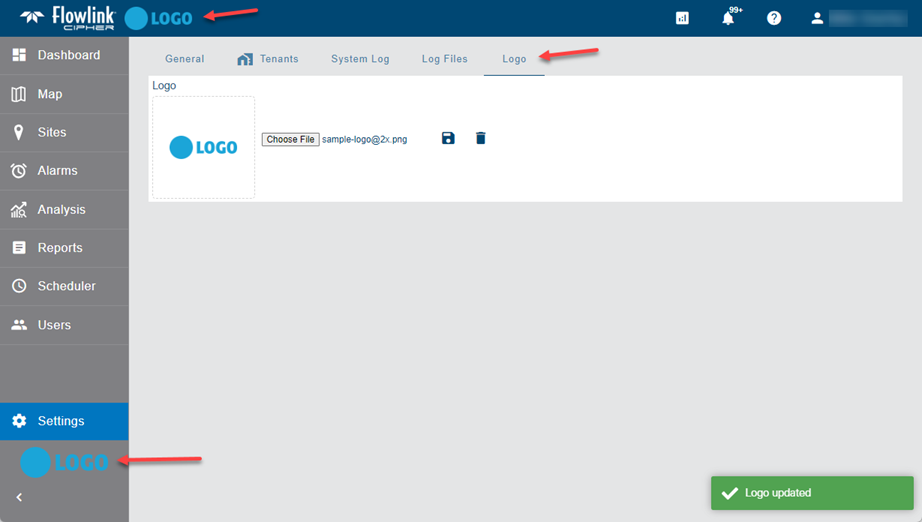
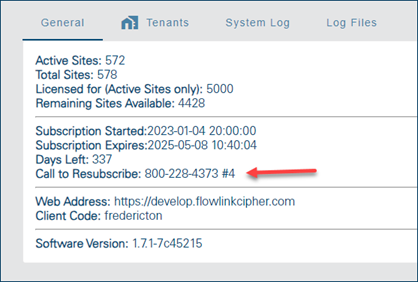
| The "System Log" and "Log Files" tabs in the Settings screen are now visible only to users with the System Administrator role, which is only available to users in the Global tenant. Previously, these two tabs were visible to Global accounts with the Administrator role. The Administrator role in the Global tenant still has access to the General tab which contains licensing information. |
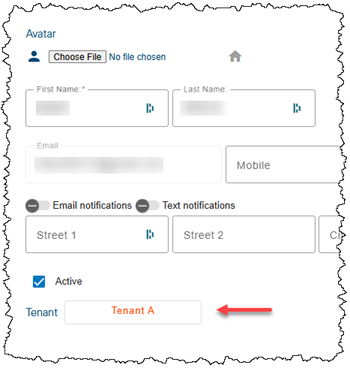
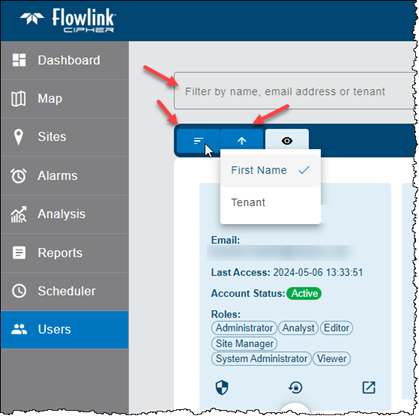
| In the Users screen, the card for each user contains the name of the tenant the user account belongs to. If a color has been assigned to the tenant in Settings, the name of the tenant on the user card will now be displayed with the tenant color. The default user symbol at the top of the card will also be displayed with the tenant color if the user has not applied an avatar to their account profile. |
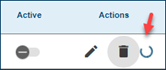
| The Administrator role has been updated to prevent users with this role from creating or modifying users with the higher security level role of System Administrator. Users with the Administrator role can use the "Active" check box to enable or disable other users in the same tenant, including the Global tenant, but cannot create or modify users with the System Administrator role in the Global tenant. The Administrator cannot:
- enable/disable a user with the System Administrator role
- create new System Administrators
- modify the roles of System Administrators
- modify any of the profile information of System Administrators
- add the System Administrator role to other users |
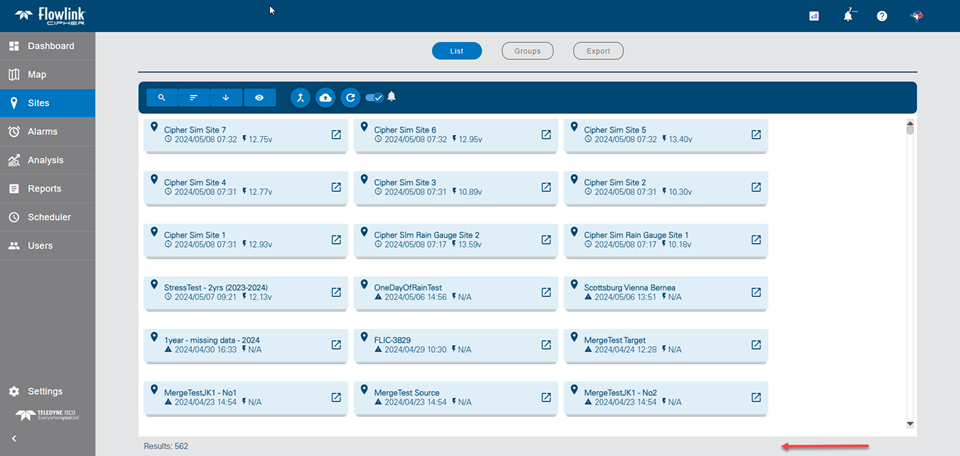
| At the bottom of the Users screen is a "Results" field displaying the number of cards currently displayed. This number was not updating when a filter was applied to reduce the number of cards displayed. This has been fixed and the "Results" count will now update. |
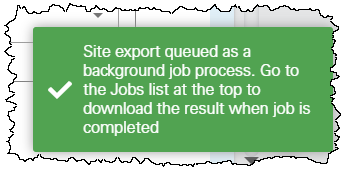
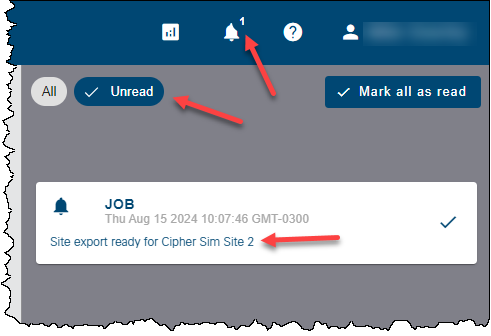
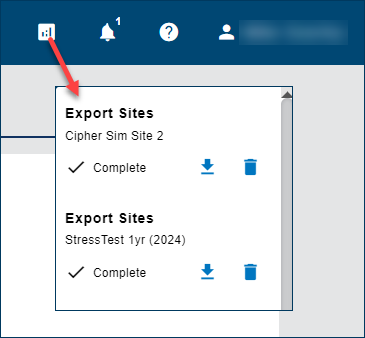
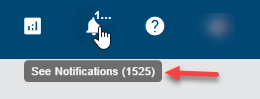
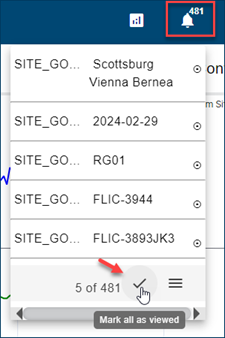
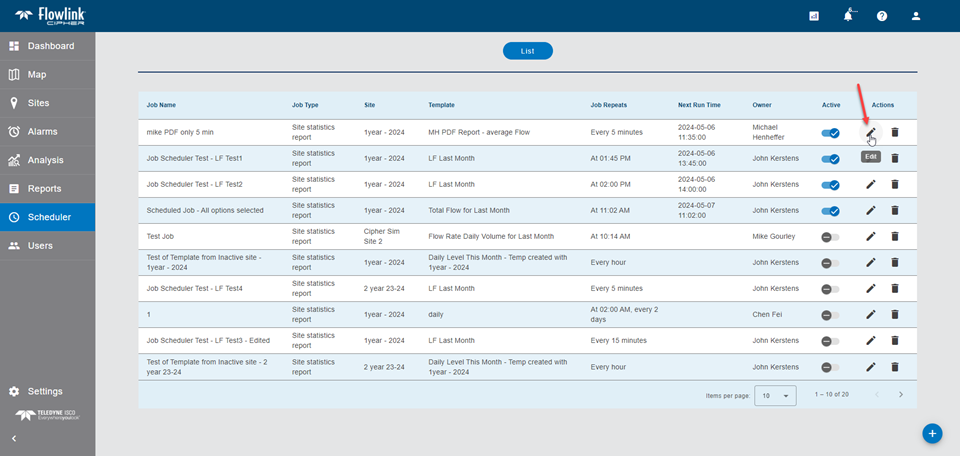
| The Viewer, Editor, and Analyst roles now have permission to view the drop-down list of jobs displayed from the Jobs button on the top menu bar. These roles previously had permission to use the Sites > Export function, but recent changes to the Export procedure now require the user to download the resulting ZIP file from the Jobs list. The Viewer, Editor, and Analyst roles now also have access to the Jobs list to complete the export procedure. |