Flowlink Cipher 1.6
This section describes all changes made to the application in the 1.6 series of releases.
1.6.7
May 2024
Maintenance
Flowlink Cipher
Scheduler | |
| A problem with scheduled jobs not producing reports has been solved. When a scheduled job selected the CSV output option and was defined with a template that had all statistics selected, the job would not complete and would not produce a report output. This has been fixed.
|
1.6.6
April 2024
Maintenance
Flowlink Cipher
Reports | |
| Reports will no longer fail to generate when a quantity included in the report has no or incomplete data in the requested time range. Previously, when creating a new report manually, the Preview function would result in a red error message that an unexpected error occurred. This was usually caused by a quantity that returned no data from the server. Also, when the report was to be generated by a scheduled job, there would not be a report stored in the Reports > List and no email received with a new report. This has been fixed. When a report is generated manually or from a template in a scheduled job and a quantity has no data or incomplete data, the report will now be generated and the intervals will be marked with a dash '-' where the statistics are normally included. It is also important to keep in mind that when using a template to generate a report, the quantities listed in the template must match the quantities available in the selected site. This has been the case since Cipher 1.6.0. |
1.6.5
April 2024
Enhancements
Flowlink Cipher
Alarms | |
| The Alarms > Settings screen now sorts the alarm panels by name.
|
| The alarm delete function now displays a confirmation prompt.
|
Dashboard | |
| Two new functions have been added to the menus of the Alarms gadget and the Silent Site gadget: "Acknowledge All Alarms" and "Resolve All Alarms". These functions will execute on all alarms in all sites currently displayed in the gadgets. The functions will also add entries to the site logs for each site that was updated.
|
| When a new site is added to Cipher, the site is now automatically selected in Alarms, Silent Site and/or Battery gadgets that have the following configurations: - The gadget is configured as a site list with the "All" check box selected. - The gadget is configured for a specific tenant and the new site is added to that tenant. - The gadget is configured for a specific site group and the new site is added to that group. |
Export | |
| The Sites > Export function now includes an "All" checkbox to select or deselect all quantities in the site for export.
|
General Application | |
| The Event Type selection lists that appear in multiple screens have been reordered. The new order is: - Data - Silent_Site - Program - Summary - Diagnostic - History - Sample - Alarm
|
Graphs | |
| The Display Events option and the Event Types selected in the graph are now properties of the graph. Graphs will now remember if the Display Events option was turned on or off when the graph was closed. When the graph is reopened, if the Display Events switch was enabled, the previously selected Event Types will be remembered. Also, the graph gadget on the dashboard will display the events.
|
| When the 'Display events' option is enabled in the main graph screen, the default event type is now the Data type. Previously, the default was the Sample type.
|
| The Description field for graph and report templates is now available for viewing in the Templates screens.
|
Logs | |
| The Site Logs and System Logs screens have been redesigned. The font has been reduced and the functions to add notes to individual log entries have been moved to a pop-up dialog box launched from a "+" button to the right of the log entry. These changes will allow more log entries to be visible on each screen.
|
Map | |
| The draw order of the site symbols on the Map screen has been updated to always display the alarmed sites on top. The draw order from top to bottom is now: - red - yellow - green - grey
|
Reports | |
| The Basic Health Report now has a Download PDF option. Also, the table in the report is now sorted alphabetically by site name.
|
Scheduler | |
| The table of jobs on the Scheduler screen now includes columns for the site name and template name of each job.
|
| New options are now provided in the Scheduler for defining the name of the report. - For the site statistics report, the default name contains 4 elements, each of which can be kept or removed, or the default name can be disabled and replaced with a user defined name. - For the health report, the default name contains 3 elements, each of which can be kept or removed, or the default name can be disabled and replaced with a user defined name.
|
Sites | |
| The 'See on map' button on the site card is now disabled when the site does not have set coordinates. To set the coordinates, go to the Map screen, select the site in the site list and use the cursor to pick the coordinates on the map, or enter the coordinates manually in the site information screen.
|
User Accounts | |
| The user's first and last name has been moved to the top of the user card instead of the user's email address.
|
Maintenance
Flowlink Cipher
Computed Datasets | |
| If the Reports function failed, there were some cases where the ID of a temporary computed dataset used to generate the report would be attached to the site and would appear in the site tree as a UUID. This will no longer occur and the temporary IDs are now removed from the database.
|
Dashboard | |
| Alarm gadgets on the dashboard would not load if the gadget was configured with a site Group or a Tenant. This has been fixed. |
Export | |
| In Sites > Export, when entering search text into the list of sites, pressing the space bar would select a site in the drop-down list instead of adding a space in the search text. The search feature has been fixed. |
Graphs | |
| The 'End of Interval' option in the Statistics Function in the graph display properties was not working, which was preventing the statistic summaries from being computed or being displayed in the graph and the table. This has been fixed. The 'End of Interval' option in the Reports function was not affected by this bug. |
| If a quantity contained duplicated points at the same timestamps, the calculation of the Total value displayed in the graph's legend and the calculation of the SUM statistic were incorrect. The calculations were using all copies of the duplicated values. This has been fixed by ensuring the graph filters out any duplicated values in the calculations. |
| Sites were not available in the site selection list in the graph configuration screen if the site was assigned to the global site group, but was located in a customer's tenant. This has been fixed. |
Reports | |
| The generation of a statistics report, either from a scheduled job or run manually, would fail to complete if the data in the site was stored out of order. Cipher has been updated to avoid the storage of time series data that is out of order, and work is ongoing to repair the existing data so that the failure of report generation will be minimized. |
Sites | |
| When exporting temperature data to a CSV file from a site or a graph, the units indicator was not recording the degrees symbol correctly as either °C or °F. This has been fixed. |
User Accounts | |
| The procedure for enabling email notifications has been improved. Previously, an account with only Viewer or Editor roles could not subscribe to email notifications. Also, the ability to unsubscribe from email notifications was limited to accounts that included the Administrator role. These problems have been fixed. Email notifications can now be enabled or disabled for any account, regardless of the assigned user roles. |
| Reopening the graph configuration screen or the compute data screen during a single session was causing the site and dataset tree to be re-populated with the previously selected site(s). This is incorrect behavior and has been fixed. |
| The search field on the Users screen was not filtering the list of users when text was entered. This has been fixed. The list can be filtered by entering text for the user First Name, Last Name or Username (email). |
| A yellow triangle symbol is now displayed beside the Email notifications option in a user profile page if a user enabled email notifications, but did not complete the activation by confirming the browser message from AWS. #iimage[AWS email notification not yet confirmed - trimmed.png]# |
1.6.4
February 2024
Enhancements
Flowlink Cipher
Alarms | |
| The Show Inactive Alarms toggle on the Alarms > Settings screen has been updated to more clearly indicate whether inactive alarms are displayed or not.
|
Dashboard | |
| Graph gadgets on the Dashboard now have functions for Refresh Data and Refresh Interval on their Options menu. - Refresh Data will return the graph display in the gadget to the time period in the graph definition. - Refresh Interval is used to change the frequency at which the data in the gadget is refreshed. The possible intervals are 1 minute, 5 minutes, 10 minutes and 15 minutes. 15 minutes is the default value.
|
Events | |
| When a Data event is generated from an alarm condition with more than one quantity, the Data Event dialog box will now display all of the quantities defined in the alarm setting.
|
Graphs | |
| In the Configure graph screen, the calendar widget for the Static time range now includes settings for the hours and minutes of the day for the start and end of the graph.
|
| The Create a new graph and Compute a new dataset function buttons on the Analysis screen are now visible at all times when the screen is loaded.
|
Map | |
| The Display Inactive Sites toggle on the Map screen has been updated to more clearly indicate whether inactive sites are turned on/off.
|
Notifications | |
| The subscription renewal emails have been updated with additional information, including Client Code, part number and contact information. The part number is determined automatically by the number of active sites, as per this table: 682541001 up to 9 active sites 682541010 10 to 24 active sites 682541025 25 to 49 active sites 682541050 50 to 99 active sites 682541100 100 to 199 active sites 682541200 200 to unlimited number of active sites per year
|
Reports | |
| The Preview and Save step of the report creation screen now contains the same summary table that will appear in the downloaded PDF and CSV files.
|
Scheduler | |
| The Scheduler now displays a "processing" indicator when the user clicks the Create Scheduled Job button to create the new job.
|
Sites | |
| The Map screen now has tools to select the Latitude and Longitude coordinates for a site. A list of available sites appears in a sliding Sites panel on the right of the map, with an Edit button for each site in the list. Clicking this button changes the cursor to a crosshair cursor which is used to select the location on the map for the site. The Save button in the list must be used to save the coordinates each time a site location is edited.
|
| The location of a site on the inset map in the site information screen can now be set manually using the following procedure: - Open the site information screen. - Pan and zoom the inset map to the relevant location - Click the Edit button in the General tab. - Move the cursor over the inset map and click the location of the site. - The Latitude and Longitude coordinates of the selected location are displayed. - Click Save.
|
| The Select Group list on the Sites > Groups page now has a Clear input button 'X' to clear the selected group and return the drop-down list to the complete list of all available groups.
|
| The Sites screen now includes a Reload Site List button to reload the list of sites and quantities available in the tenant.
|
| The Sites screen now has a Sort by Groups option.
|
User Accounts | |
| The Show Inactive Accounts toggle on the Users screen has been updated to more clearly indicate whether inactive accounts are displayed or not.
|
| Users with the Administrator role can now import ISCO files in the CSV and DDP formats using the Import ISCO Data function on the Sites screen. If the user with the Administrator role is in an enclave, then the data will be uploaded into the same enclave and accessible only to the users in that enclave and Global users. This improvement is a follow up to the previous release which expanded the access to functions for a user with the Administrator role. |
| The search bar on the Users screen now provides searching by the account username, which is the email address of the user, as well as the first and last name of the user.
|
| The email address for user accounts is now disabled once the account becomes active. This will prevent attempts to alter the email address of the account, which is the username of the account.
|
Maintenance
Flowlink Cipher
Dashboard | |
| Previously the "All" checkbox to enable the selection of all sites in the Alarms, Silent Site and Battery gadgets was not working as expected. This has been fixed. |
Graphs | |
| Previously, when a new graph was created from the 'Quick Graph' function on the site card, the legend in the main graph screen would include an extra set of empty parentheses for each quantity. This has been fixed. |
| The 'Show public graphs' button on the Analysis screen now displays a different symbol depending on whether public graphs are on or off.
|
Import | |
| Previously, the Import ISCO Data function was expecting the Resolution row in the header to contain only integer values. This is incorrect as the Flowlink 5 Export function will populate the Resolution with floating point numbers. This has been fixed. |
Reports | |
| Users in an enclave without the Administrator role were not able to download the PDF and CSV report files from the Reports > List screen. This has been fixed. |
Sites | |
| When using the "Level, Velocity and Flow Rate from site" quick graph function on a site card, the datasets added to the graph did not follow the order of the datasets in the Device panel on the site information screen. This has been fixed. |
1.6.3
February 2024
Enhancements
Flowlink Cipher
User Accounts | |
| The list of available roles for a new user account now includes the API role. This role provides access to the API for uploading and downloading data from Cipher. The role can be applied to a user in an enclave, which will limit the user's access to only data in that enclave.
|
1.6.2
February 2024
Enhancements
Flowlink Cipher
Dashboard | |
| The graph gadget now has a search bar at the top of the drop-down list of available graphs.
|
General Application | |
| The password reset procedure has been simplified. Previously, when a user selected the Forgot Password option on the login screen, a message was sent to System Administrator who would then need to initiate the password reset. Now, when a user selects Forgot Password, the system will send a password reset email directly to the user with a link to Change Password. The email link is valid for 1 hour.
|
| The drop-down lists for selecting sites for several functions have been improved to make it easier for the user to find the site(s) of interest. This includes the following functions: - Dashboard gadgets - Sites > Merge Datasets - Sites > Groups - Sites > Export - Alarms > List - Alarms > Settings > Configure Alarm - Analysis > Configure graph - Analysis > Compute dataset - Analysis > Search - Analysis > Templates - Reports > Create New Report > Site statistics > Step 2 Select datasets - Reports > Templates - Scheduler > Create Scheduled Job > Site statistics
|
| The Administrator role now has additional permissions to execute the following functions: - Enable and disable sites - Delete sites - Modify public graphs by changing the configuration of the graph, including the ability to remove the Public option. - Delete public graphs - Delete public graph templates - Edit and delete alarm settings - Delete shared dashboards - Merge datasets |
Graphs | |
| The "Week" interval option in the Statistics Function of the graph display properties will now generate the statistics based on calendar weeks. The start of the calendar week is defined by the Start of week option in the user's preferences.
|
| The "Month" interval option in the Statistics Function of the graph display properties will now generate the statistics based on calendar months. Previously the Month statistics were compiled on 30 day intervals.
|
| A "Saving graph" animation will now display when a new graph is being created or when the graph configuration has been updated.
|
| The Export graph to CSV function in the main graph screen now launches a dialog box with an option to 'Include summary table'. When selected, additional rows are added to the CSV file with summary statistics of the data in the graph.
|
| The following changes have been made to the graph and graph tiles on the Analysis screen: - title and subtitle have smaller font size - subtitle is no longer mandatory and is empty by default - subtitle is moved to the bottom of the graph tile - long title names no longer overlap with the function buttons
|
Scheduler | |
| The Description field in the Create Scheduled Job screen is no longer mandatory. |
| The email sent by the Scheduler will now include the name of the user that generated the report. Previously, the email contained the username of the user's account, which has now been removed.
|
Sites | |
| Existing data in inactive sites may now be used in several functions. Previously, data in inactive sites was not available in analysis or other functions. There is no change to the behavior of ingesting data to inactive sites; a site must be active for new data to be ingested to the site. The functions which now allow inactive sites to be selected and their existing data to be used are: - Creating a graph - Adding a site to a site group - Creating a computed dataset - Filtering the Alarms table - Filtering the Reports list - Creating a new report - Creating a new scheduled job - Exporting site data |
Maintenance
Flowlink Cipher
Alarms | |
| When an alarm setting was defined with conditions from more than one quantity, the data events were not being triggered as expected. This has been fixed. |
| Users in a tenant were able to see and subscribe to alarm settings for all sites in other tenants, including global sites. This has been fixed. Users in a tenant are now only able to see and subscribe to alarm settings for sites in their tenant. |
Computed Datasets | |
| When computing the Count statistic with the Statistics function in Computed Datasets, the unit applied to the Count data was the same unit as the quantity used in the function. This has been fixed. The Count statistic now has the "Generic" unit applied, which means the Count values are unitless. |
Dashboard | |
| A user in a tenant will now only see the shared dashboards from other users in the same tenant. Previously, the shared dashboards from users in other tenants were visible. |
Events | |
| The "within" option for detecting Rainfall events was not working as expected. This has been fixed.
|
Export | |
| When using the Relative option "Last Month" in the Sites > Export function, the data points for the first day of the month were missing. This has been fixed. |
| The default filenames for PDF and CSV files generated by the Reports function were longer than was necessary. The default filename pattern has now been reduced to: Site statistics - siteName - timeStamp.pdf/csv |
Graphs | |
| The "Hour" interval option in the Statistics Function of the graph display properties was excluding the result for the first hour if the time range of the graph started after midnight. This has been fixed.
|
| The Average and Volume Operations of the Statistics Function in the graph display properties were excluding the first point in each interval. This has been fixed.
|
| The Statistics Functions applied in the graph display properties were missing the results for the last interval period. The functions now calculate and display a result for each interval in the time period of the graph.
|
| The summary table in the PDF generated from the Export graph to PDF function in the main graph screen will now display a Total value only for Rainfall datasets and Volume and Average statistics for Flow Rate datasets. |
| The unit for Flow Rate Average displayed in the bottom row of the graph table now correctly matches the unit for Flow Rate selected in the display properties for the dataset. |
| The names of the graph statistics functions (Average, Minimum, Maximum, Sum and Volume) that have been selected for inclusion in a graph are now displayed in these locations: - graph configuration screen legend - main graph screen legend - CSV file exported from main graph screen - PDF file exported from main graph screen (legend, table and summary table) |
| When the Average statistic function is applied to a dataset in a graph, the legend will now display the text (Average). Previously the statistic was displayed as (Mean) in the legend. |
Reports | |
| The summary table in the PDF and CSV output from Reports was including a Total value for the pH quantity. This has been removed. The Total column in the summary table will now only display a value for Rainfall and for the Volume and Average statistics for Flow Rate quantities. |
| When the Reports function generated statistics for a time period that included intervals without data, the report displayed the timestamp 1970-01-01 00:00:00. This has been fixed. Empty intervals in the report are now filled with the hyphen '-' character. |
Sites | |
| The Sites > Groups functions were not operating as expected in the previous version of the software. This has been fixed. |
1.6.1
November 2023
Enhancements
Flowlink Cipher
Computed Datasets | |
| Users are now able to select the input units for some parameters of the Manning Formula, Area Velocity, and Weir functions.
|
General Application | |
| Time range selection for a graph, a report, or the export of site data is now limited to a maximum of 1 year. For a Relative time range with the Custom option, the limit is a maximum of 1 year from the timestamp of the last datapoint. Attempting to select more than 1 year for a Static time range, or the All time range when the time range of the data is greater than 1 year, will display a message that the time range is limited to 1 year.
|
| The email generated by the Submit Feedback function now includes the Client Code. Previously, only the URL of the multitenant deployment was included, which does not indicate the customer that generated the email. |
Graphs | |
| The management of events in the database has been optimized, which will improve the performance of event queries during event detection. |
Maintenance
Flowlink Cipher
Dashboard | |
| The drop-down list of available graphs in the graph gadget on the dashboard would sometimes display the name of a public graph twice. This has been fixed. - The name of each private and public graph will now appear once in the drop-down list. - The globe symbol indicating a graph is public will now appear next to the name of public graphs. |
| The 'Graph from site' function was available in the Options menu of a site gadget when the current user had only the Viewer or Site Manager role, which do not have permission to create a new graph. This has been fixed and the function is only available to users with the necessary roles. |
Events | |
| Changing the status of a data event using the Data Event dialog box was not automatically updating the status of the event in the Events table when the dialog box was closed, requiring the table to be refreshed manually. This has been fixed. |
General Application | |
| Repeated ingestion of data from a site was previously generating duplicated points in the database. This problem was visible to the user in the cursor tooltip in the graphs. This ingestion problem has been fixed. |
| Some of the deployments of Flowlink Cipher 1.6.0 were displaying a message on first login that the version was 1.4.3. This has been fixed. |
| Importing a CSV file was failing if there were extra empty lines at the end of the file. This has been fixed. |
| Datasets exported to CSV files now contain seconds in the timestamps. Previously, the timestamps contained hours and minutes but not the seconds.
|
Graphs | |
| Public graphs created by a Global user, using a site from a non-Global tenant were not visible to the users in the same tenant as the site. This has been fixed. The following rules apply: - Public graphs created by a Global user with a site from a non-Global tenant will be visible to the users in the same tenant as the site. - Public graphs created by a Global user with sites from multiple tenants will be visible only to other Global users. - Public graphs created by a user in a non-Global tenant will be visible to Global users. |
| In the dataset display properties dialog box of the Configure Graph screen, when the Statistics Function option is turned on, the Operations field will now display the Average function by default. A different function can be selected from the drop-down list if needed. Previously, there was no default function displayed, but the Average function was applied to the graph when the dialog box was closed. This has been fixed. |
| Rainfall datasets with the 'Total' value option applied were displaying the 'Total' value in the graph legend when viewed in the Flowlink Cipher, but not when the graph was exported to PDF. This has been fixed and the 'Total" value is now included in the legend of exported graphs. |
Reports | |
| In the Reports > List page, searching by report name was previously case sensitive. This has been fixed. Searching by name is now case insensitive. |
| In the Reports > Preview screen, not all of the digits for the statistics results would be visible if there were a large number of quantities included in the statistics and/or the number of digits in the results were large. This has been fixed in the Preview by the addition of a horizontal scroll bar when needed to view all of the results. |
| In Step 3: Select Statistics of the site statistics report creator there was not enough space on the screen for the panels when a large number of quantities was selected for the report. This has been fixed by the addition of a horizontal scroll bar that appears when necessary. |
Sites | |
| The color of the site symbol in the inset map on the site information screen sometimes did not match the correct color of the symbol on the main Map screen. This has been fixed. |
| Multiple issues were reported for the deletion of sites and sites missing from some site selection drop-down lists, such as the site gadget on the dashboard. This has been traced to a missing setting on the internal tenant (enclave) and has been fixed. |
| The sort order of the datasets in the Devices tab of the site information screen was not being applied in the selection of the Level, Velocity and Flow Rate datasets for the site gadget and quick graph function. This has been fixed. |
| The device panel in the site information screen will now retrieve the Serial Number and TCP Address from the latest PROGRAM event for the site if there is a PROGRAM event available. The other values on the device panel for Model Number, Software Version, Hardware Version, and BootCode version will still be retrieved from the configDetails or metadata ingested by the site.
|
| Sites that did not have any events were not displaying the inset map on the site information screen. This has been fixed. |
| The site export function was not exporting the first point of the day when using the Relative time range option. This has been fixed. |
Templates | |
| Changes made to the public template, "Level, Velocity, Flow Rate template", were not being saved. This resulted in the template changes not being reflected in graphs created using the Level, Velocity and Flow Rate graph button found on Site cards. This has been fixed. |
Tenants | |
| In the Settings > Tenants screen, it was not possible to create a tenant with a site count limit of 1 when the license limit of the customer was 1 and there was already a site created in the Global tenant. This was because there was an assumption that the total of all site count limits for all tenants plus the active Global site count should not exceed the site license limit of the customer. This has been fixed by changing the site count tests as follows: - For each tenant, the site count limit should not be greater than the maximum allowed number of sites for the customer, which is the Licensed for (Active Sites only) value on the Settings > General screen. - For each tenant, the site count cannot be less than the current active site count for the tenant. This will prevent the user from entering a site count limit for the tenant that is less than the number of active sites in the tenant. When the site license limit of the customer has already been reached by the number of active sites, any new sites created through ingestion processes will continue to be marked as inactive sites. This has not changed. |
User Accounts | |
| The Reset Password feature on the login screen was resulting in an error message and failed to complete. This has been fixed. |
| Changes made in the Graph panel on the Preferences tab of the User Profile page are now being saved. Previously, the changes were not being saved and settings for values such as 'Start of the day' were not being applied in graphs. |
1.6.0
October 2023
Enhancements
Flowlink Cipher
General Application | |
| Drop-down lists for selecting Units in several screens in Cipher have been updated to display a sorted list of Unit names with abbreviations. |
| All drop-down lists for selecting Units are now sorted alphabetically. |
Graphs | |
| A graph template can now be created from an existing graph. When a graph is reopened in the graph configuration screen, the user may select the Save as Template option and populate a template name and description which will save a new template when the graph is updated. |
| The graph template creation has been upgraded to include the names of the datasets included in the template and not just the dataset types. When using a new graph template to create a graph, the function will attempt to match dataset names with the datasets in the selected site. If there is no match to the dataset name, then the function will attempt to match the dataset type.
|
Notifications | |
| The Client Code has been added to the notification emails sent to users as reminders of the upcoming license expiry date.
|
Reports | |
| The Report template now records the names of the datasets. When a template is used to generate a new report, the names of the datasets in the template will be used to find matches in the site selected for the report. Previously, only the type of dataset was used for matching, which resulted in unexpected datasets included in the statistics report.
|
Sites | |
| The Import ISCO Data function has been updated with an option to select the date format of the CSV files. |
| A Close button has been added to the Import ISCO Data dialog box. |
| When an inactive site attempts to push data into Flowlink Cipher, a new notification will appear in the Notifications panel. The notification will be labeled as MESSAGE and the text will include: "Quantity _____ tried to push data, but Site ____ is inactive. Data was not logged."
|
Maintenance
Flowlink Cipher
Alarms | |
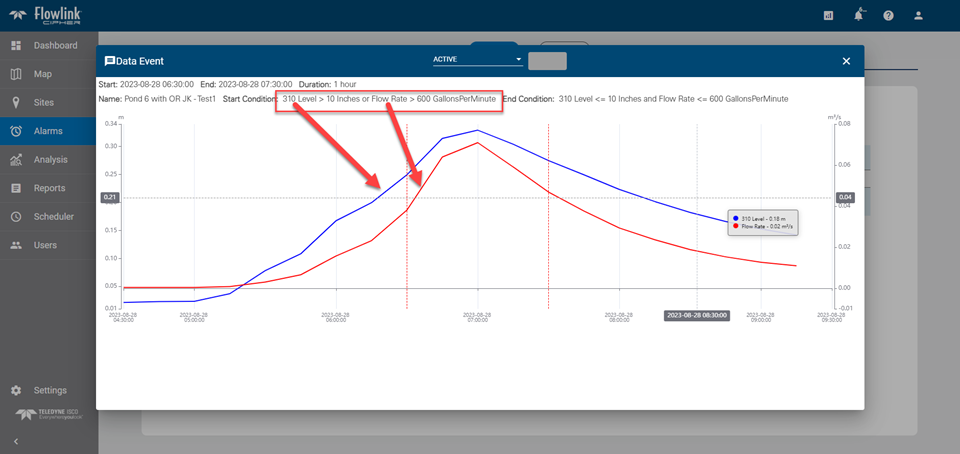
| The Duration option in the Alarm Setting was not being used to determine when to trigger an alarm. This has been fixed. |
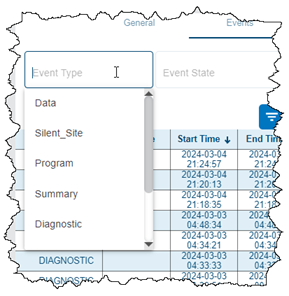
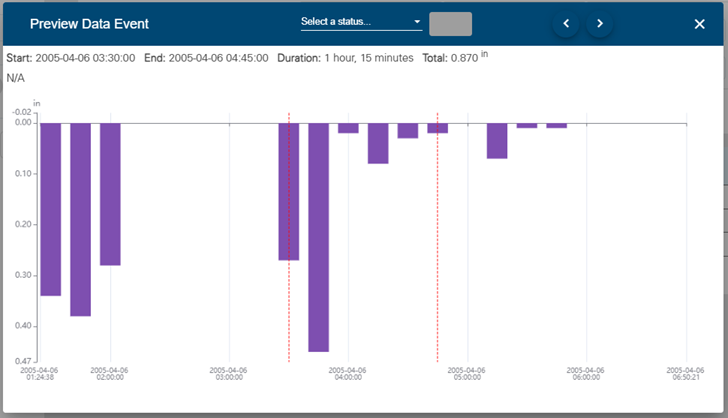
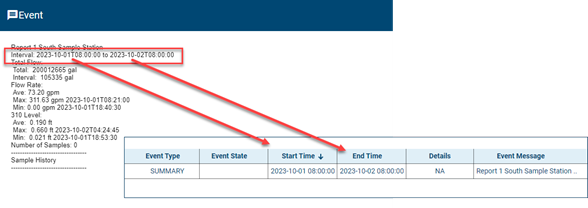
| The Start Time and End Time for SUMMARY events, as seen in the Alarms table and the Events table, now match the time range provided by the Interval field in the SUMMARY information. Previously, the startTime and endTime values from the SUMMARY information were used. This change will be seen in new SUMMARY events ingested going forward.
|
Computed Datasets | |
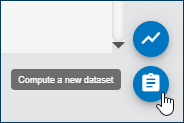
| The appearance of zero or negative values in Level data that was used to compute new Flow Rate quantities was causing spikes to appear in the graphs of the new Flow Rate data. This has been fixed by detecting zero and negative Level values and outputting zero values for the computed Flow Rate data points. |
Dashboard | |
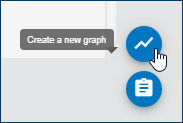
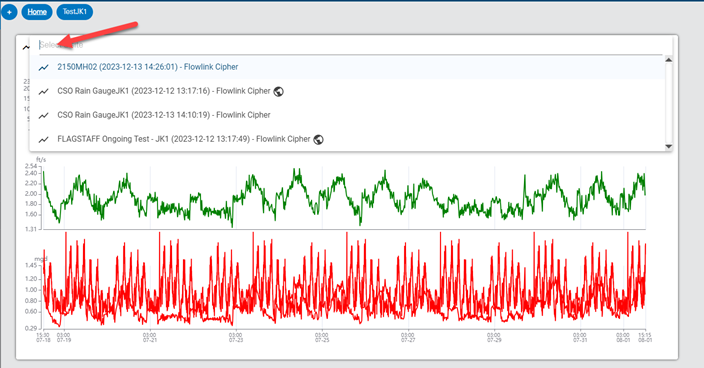
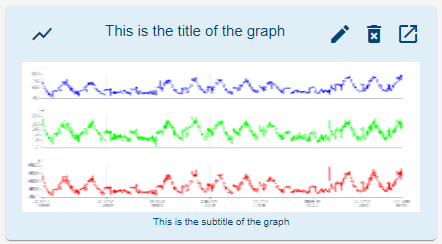
| When creating a new graph from a site gadget on the dashboard, the graph's legend now correctly displays the average and total values for each dataset. The site for each dataset is also included in the legend. Previously, the "Graph from site" function in the site gadget was not populating the legend with the same information as the legend would contain when the graph was created from the Analysis screen. This has been fixed. |
Export | |
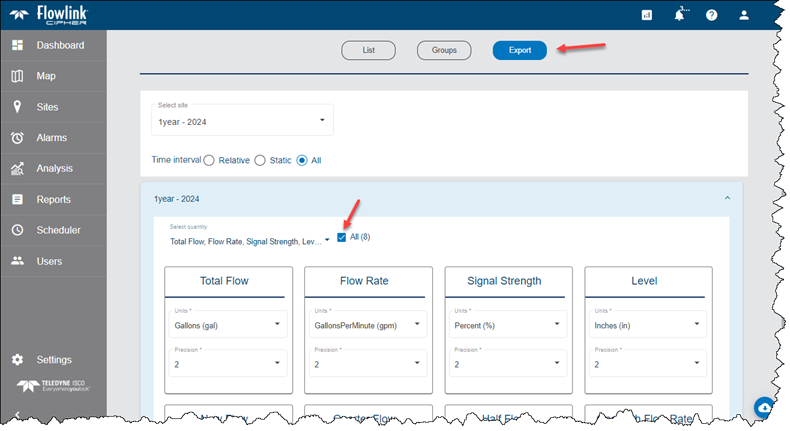
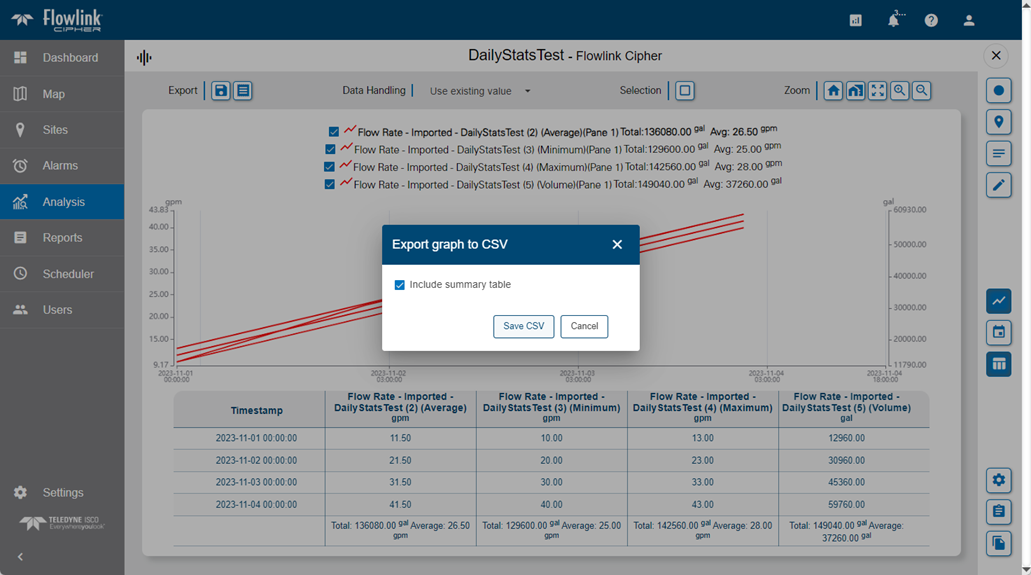
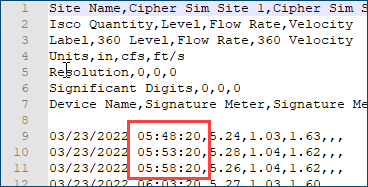
| The Export graph to CSV function in the main graph screen now outputs the quantity name "Flow Rate" instead of "FlowRate". This change also applies to the Sites > Export function. The exported CSV files can now be imported directly to Flowlink 5.1 software from Teledyne ISCO. |
General Application | |
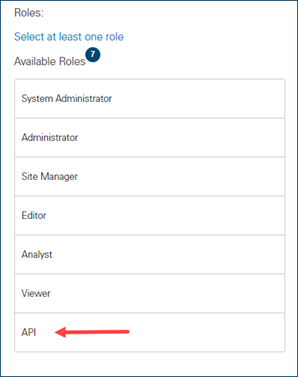
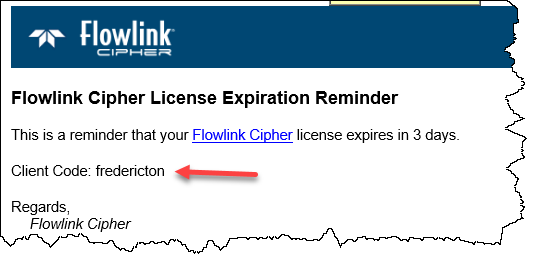
| In the first release of the multitenant system in Flowlink Cipher 1.5.0, the new account setup procedure was not requiring the new users to scroll to the end of the End User License Agreement (EULA). This has been fixed. To complete the setup of a new user, the EULA must be scrolled to the end before the checkbox "I understand and accept the Terms of Use" can be used. |
| The Data Start and Data End timestamps for quantity data in the Dataset Properties dialog box were always being displayed with a UTC offset correction. This has been fixed and the timestamps are now displayed in the originally recorded local time. |
Graphs | |
| Sites occasionally could not be deactivated using the Activate/Deactivate check box on the site card. This has been fixed. |
| The position of the left and right Y-axes will now adjust automatically to allow all of the digits for the annotations to be visible next to the axes. Previously, there was a limited amount of space available and in some cases some of the digits were not visible. |
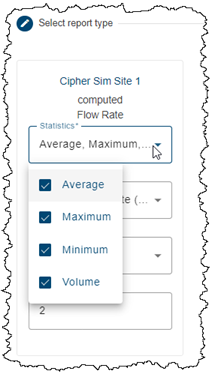
| A drop-down list of available Volume units is now provided in the Graph Properties when the Volume statistic is applied to the Flow Rate quantity in a graph. Previously, the Volume statistic was presented on the graph only with default Volume units. |
| In some cases, manually setting maximum and minimum annotation values for the left hand Y-axis of the graph was altering the annotations of the right hand Y-axis. For example, if the Flow Rate quantity was added to a panel twice, and one copy was set to compute the Volume statistic, manually defining the maximum/minimum Flow Rate for the left hand axis was unexpectedly changing the annotations for the Volume on the right hand axis. This has been fixed. |
| The Export graph to PDF function in the main graph screen was failing in some cases when the graph included a quantity with a statistic function applied. This has been fixed. |
| In some newly created graphs, the first point in the timeline was plotted on the graph close to the left-hand Y-axis but the time series line did not begin until the second point. This created a visible gap on the left end of the graph. This has been fixed. |
| Toggling a dataset on/off with the check box in the legend now works as expected. Previously, the check box toggle for a single dataset was affecting multiple datasets in the graph. This has been fixed. |
| The Export graph to CSV function in the main graph screen would not include the data during the 2 AM time period on March 12, 2023, due an error in handling the switch to Daylight Savings Time. This has been fixed. |
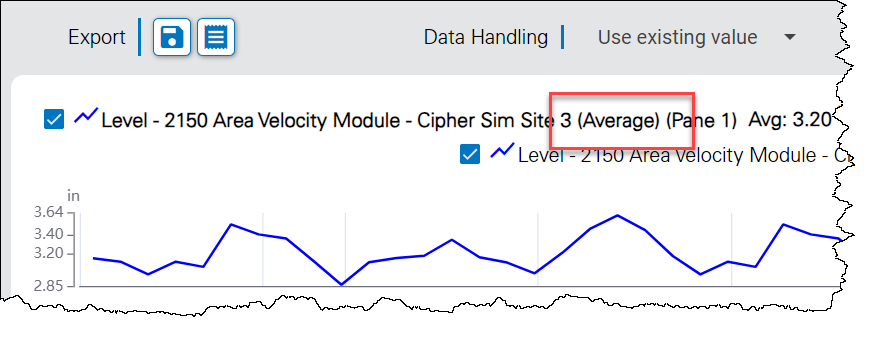
| The graph legend now includes "(Average)" beside the dataset name when the "Display Average" option is enabled in the Dataset Display Properties. Previously the legend displayed "(Mean)".
|
| Scrolling the data table in the main graph screen has been improved. Previously, the use of the scroll wheel on the mouse, or the vertical scroll bar on the table, would intermittently not move the table up or down as expected. This has been fixed. |
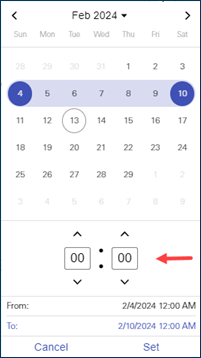
| Opening an existing Static graph in the graph configuration screen no longer causes the date picker widget to display automatically. If the user needs to change the Static date range, the widget can be displayed by clicking in the field. |
| The Select Points by Rectangle control no longer becomes disabled when the user changes the time range of the graph using the zoom controls, including the scroll wheel on the mouse. Previously, if the Select Points by Rectangle feature was active and the user zoomed the graph in/out, the Select button would still appear to be enabled but the cursor reverted to click and drag/pan mode. This has been fixed. |
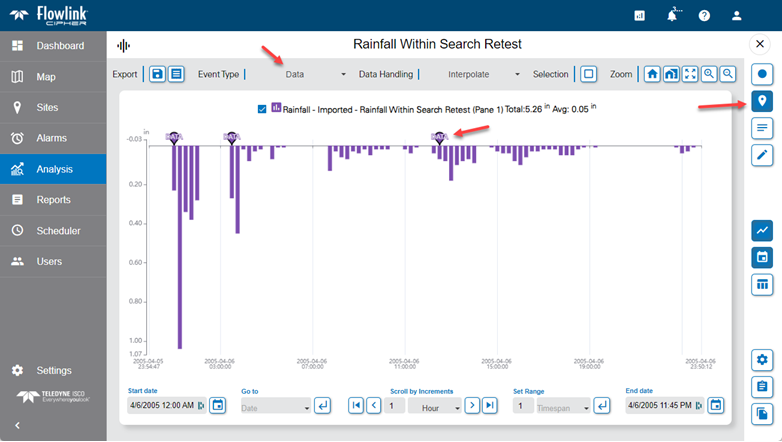
| When the option 'Toggle original data' is enabled in the main graph screen, the portion of the graph with the original data will now be displayed in a dark red color. Previously, the original data was displayed as blue. |
Reports | |
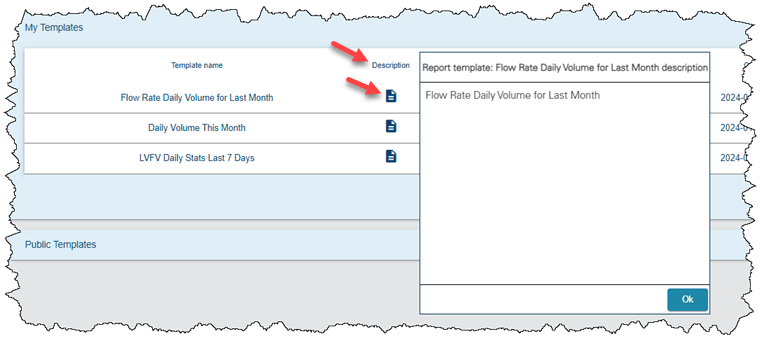
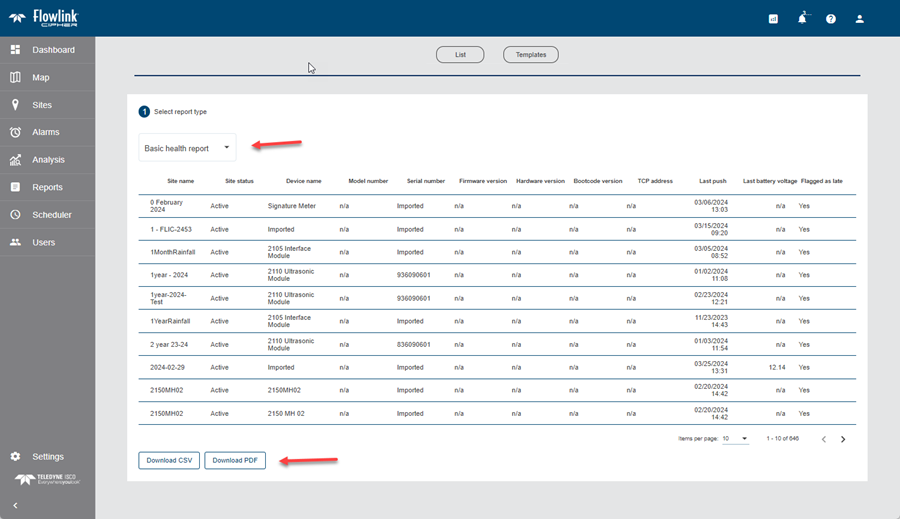
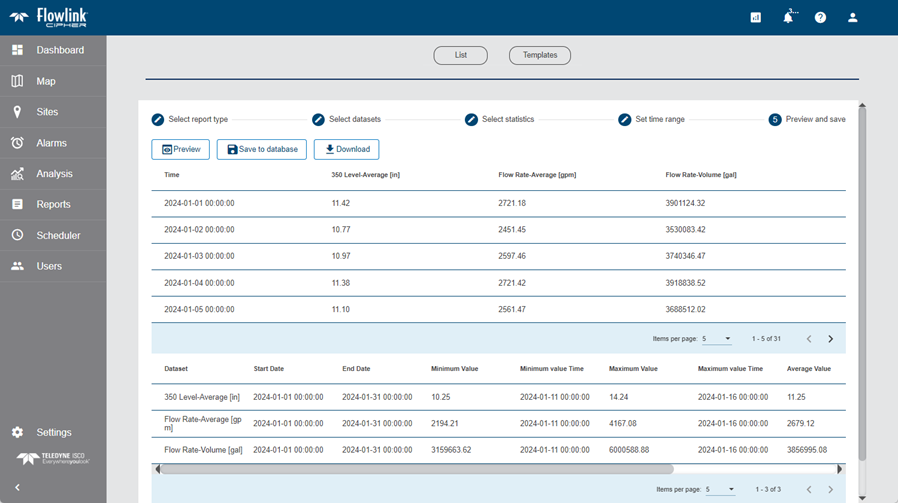
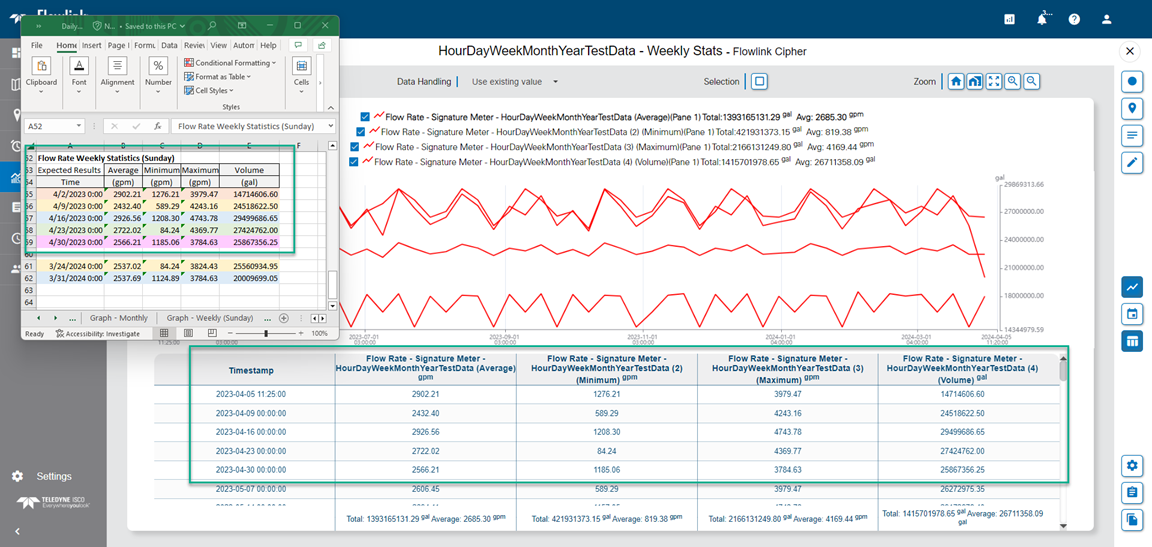
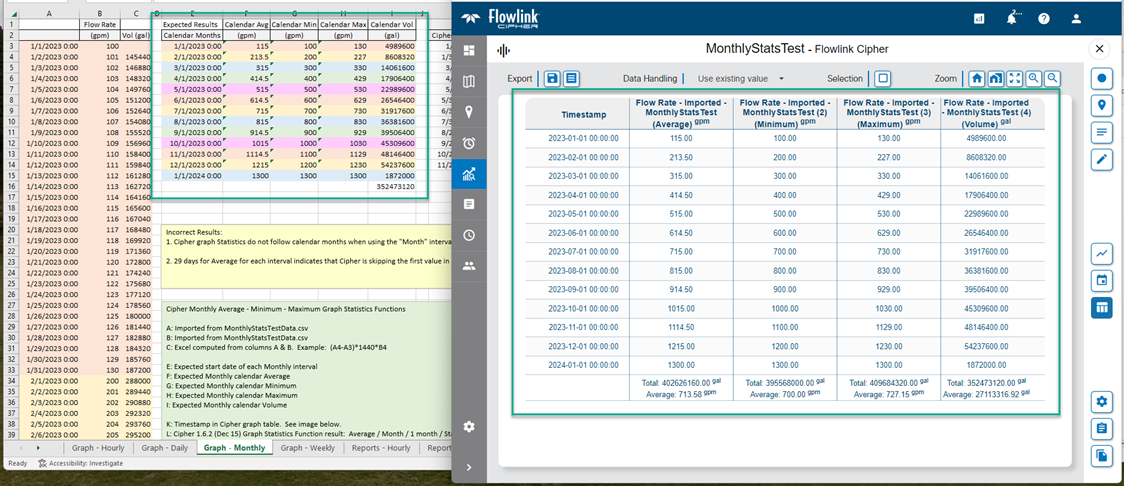
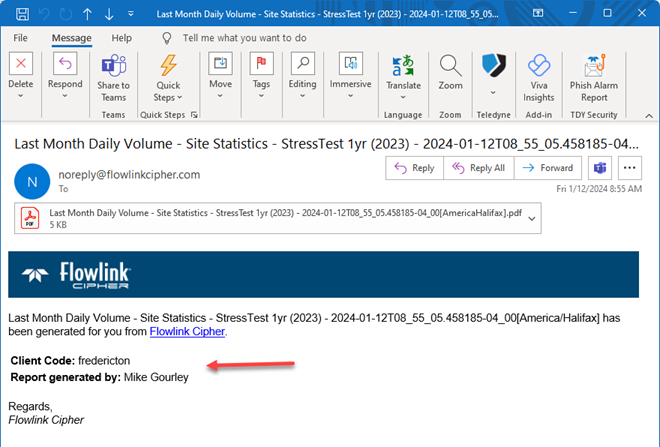
| The total Volume in the summary table at the bottom of PDF and CSV files generated by the Reports and Scheduler functions is now correct. |
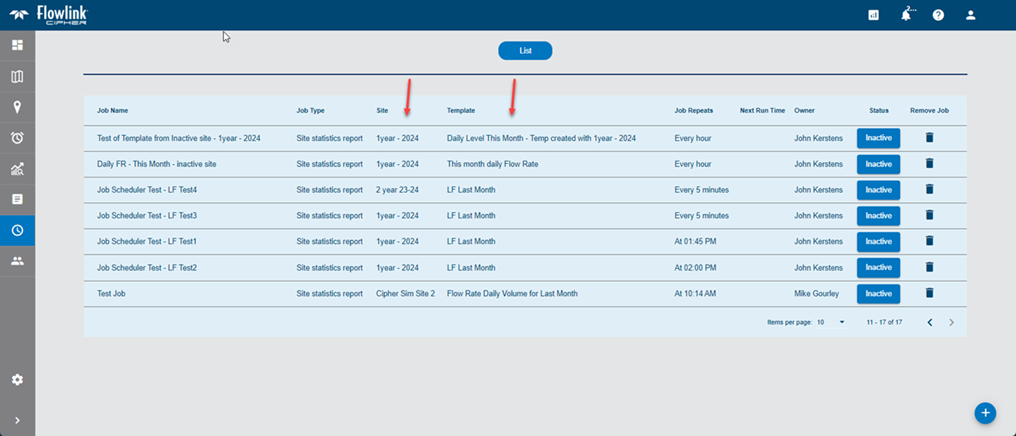
Scheduler | |
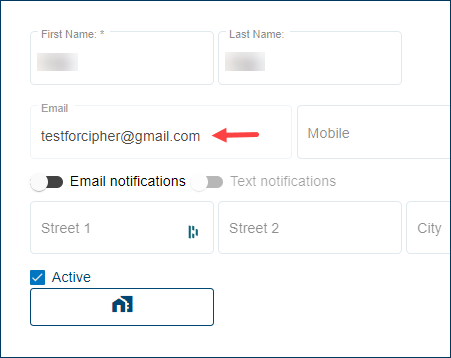
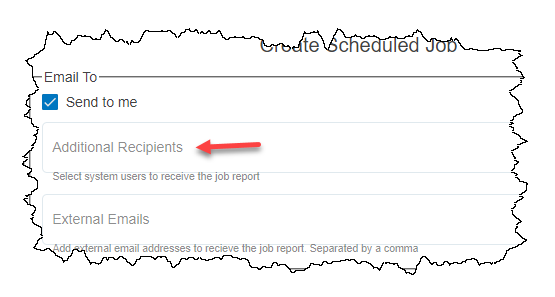
| When defining a new scheduled job and selecting additional recipients for the email, the list of available user accounts is now sorted alphabetically.
|
Sites | |
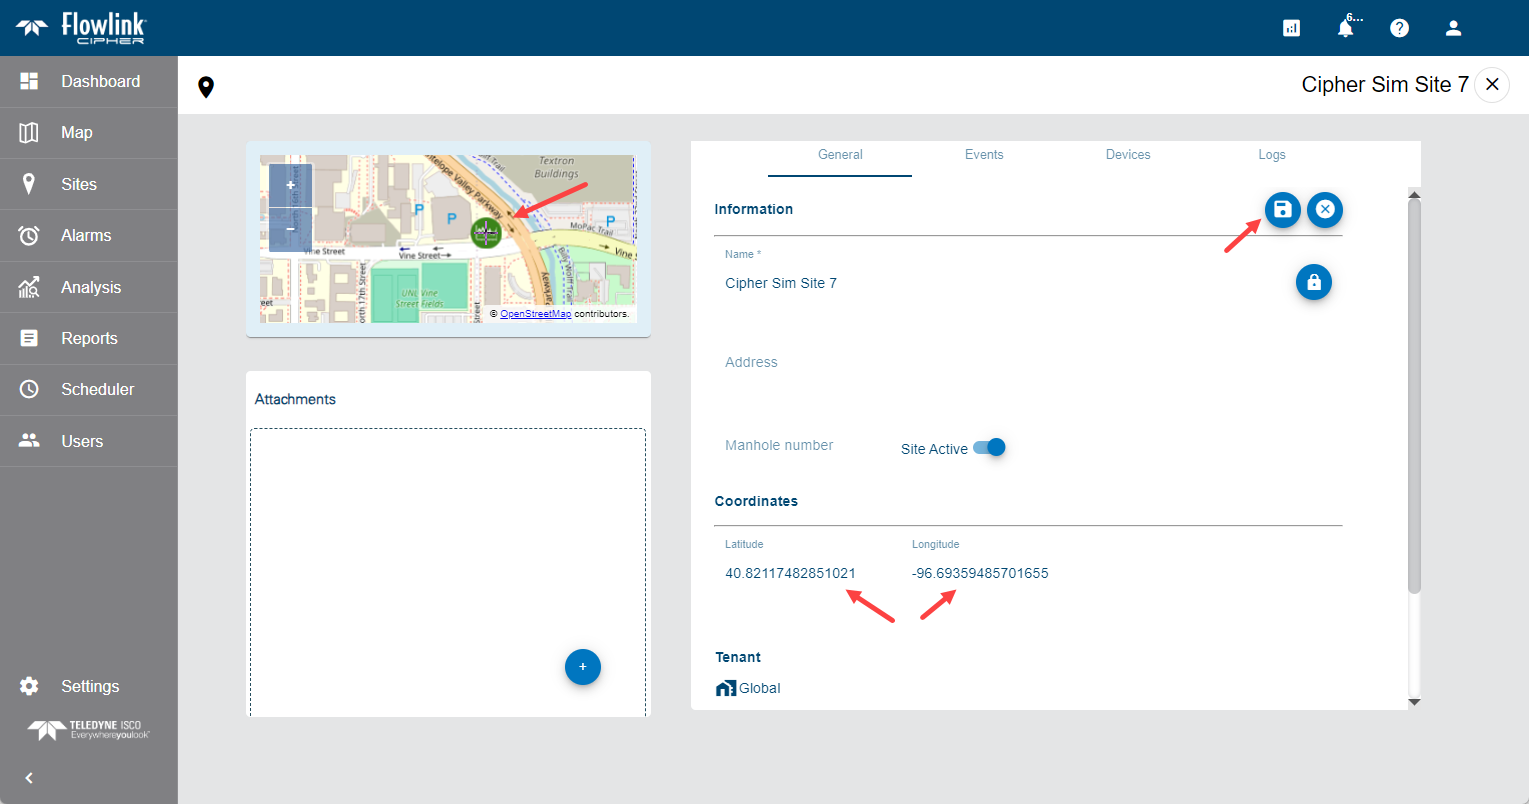
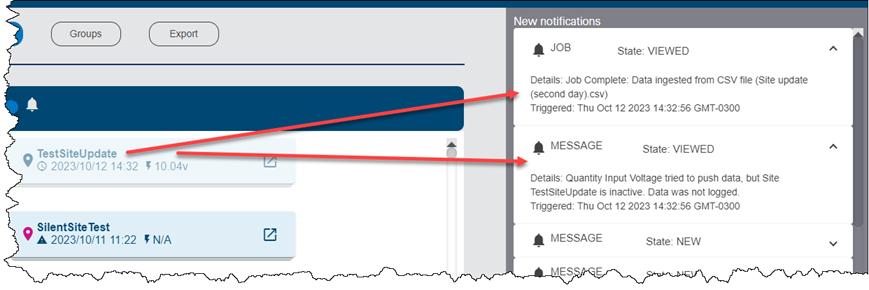
| Previously in multitenant deployments the Data Last Received value was displayed as "N/A" on the General tab of the site information screen. This has been fixed. |
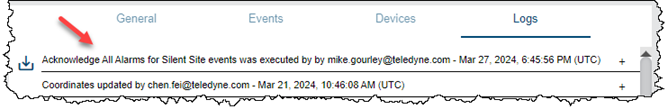
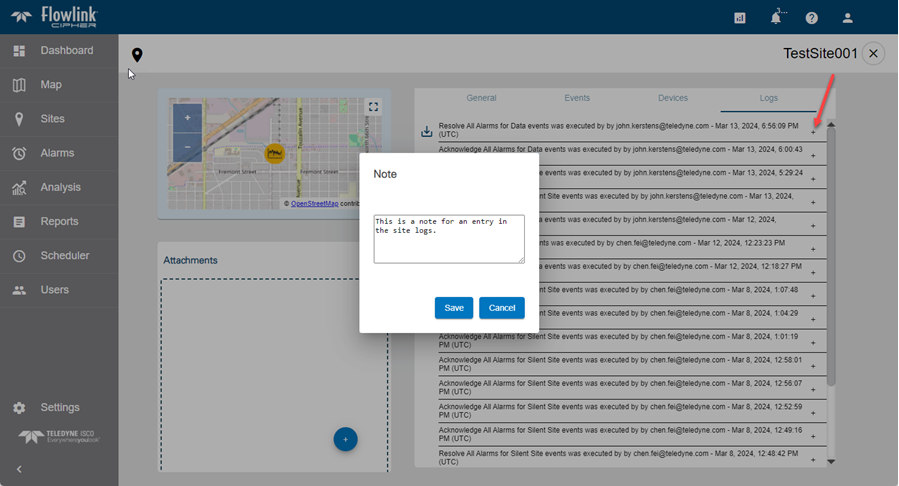
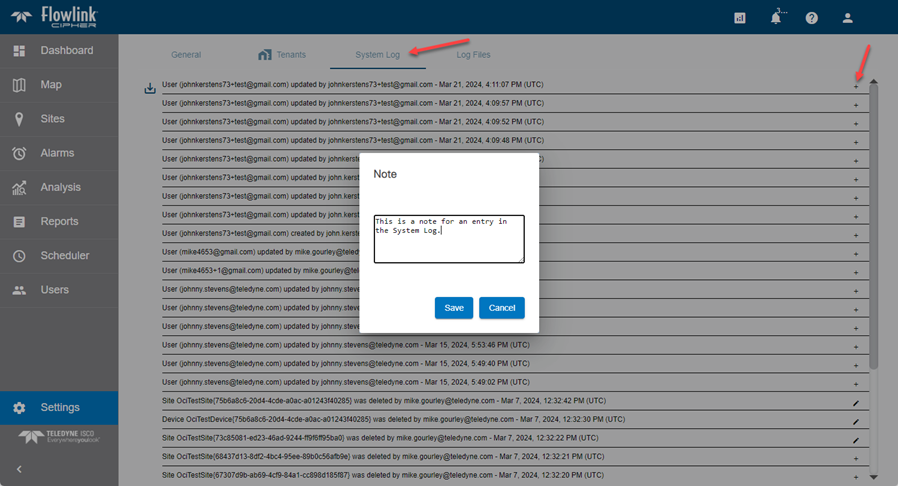
| Adding notes to the site log entries was not working in the multitenant deployments. This has been fixed. |
| Images added to sites as attachments would not render if the filenames used uppercase letters for the file extensions. This has been fixed. |
Templates | |
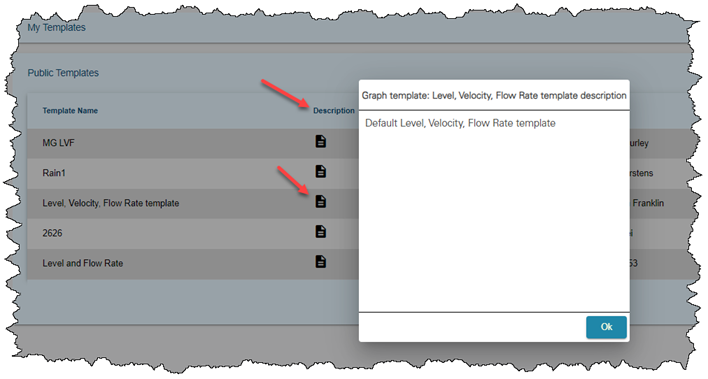
| Users are now able to delete a public graph template they created. Previously, users were not able to delete a template they created if the template was marked as a public template. |
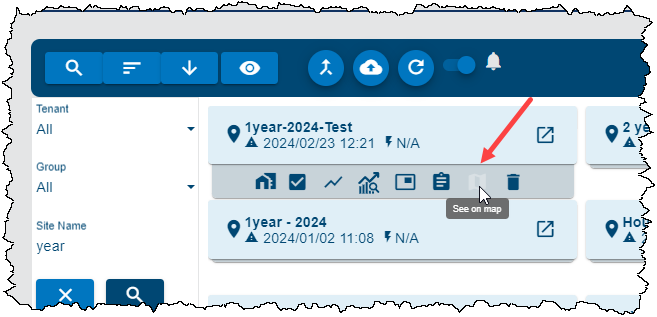
Tenants | |
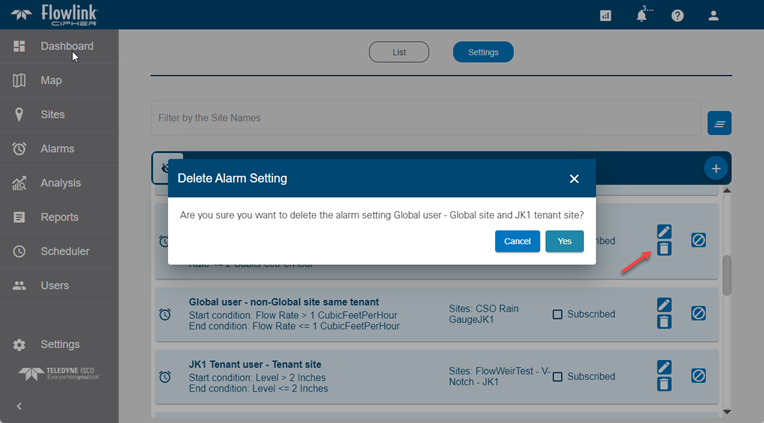
| The tenant delete function in the Settings screen was failing if the sites in the tenant had already been deleted. The user can now successfully delete a tenant in Settings regardless of whether there are sites in the tenant or not. When sites are still in a tenant and the tenant is deleted, the sites are moved to the Holding Tank and disabled. From the Sites screen, the sites in the Holding Tank can be deleted or moved to another tenant before enabling the sites if desired. |