Events | |
| Events are now indexed by site in the database, improving the performance of the retrieval and filtering of events in the Alarms and site information screens. |
Flowlink Cipher 1.4
This section describes all changes made to the application in the 1.4 series of releases.
1.4.2
February 2023
Enhancements
Flowlink Cipher
Events | |
| Events are now indexed by site in the database, improving the performance of the retrieval and filtering of events in the Alarms and site information screens. |
Maintenance
Flowlink Cipher
Export | |
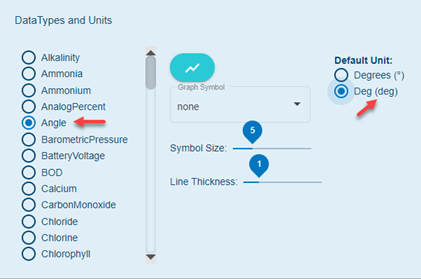
| Previously, a CSV file exported from a graph, or from the Site > Export function, would use the degree ° symbol as the unit indicator for Angle type datasets. This unit is not accepted by the Flowlink 5 Import function. Flowlink Cipher now includes an additional unit option for Angle type datasets: deg. This new unit option is available in the Preferences tab of the user profile page and in the unit selection control for Angle type datasets for graphs, site export and reports.
|
Sites | |
| Previously, on some of the production instances of Cipher, the importing of ISCO files (CSV, DDP) would fail because the length of filenames was limited to a total of 12 characters. This has been fixed. |
1.4.1
February 2023
Enhancements
Flowlink Cipher
Graphs | |
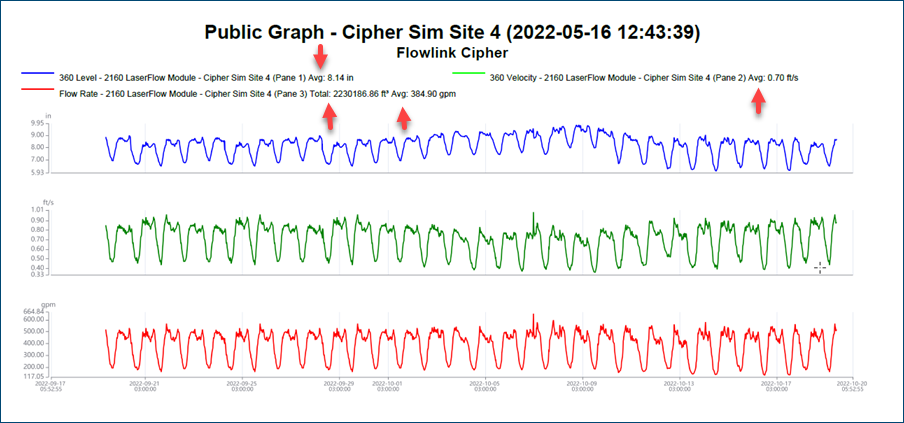
| The "Export graph to PDF" function in the main graph screen will now include the Average and Total values in the legend.
|
Map | |
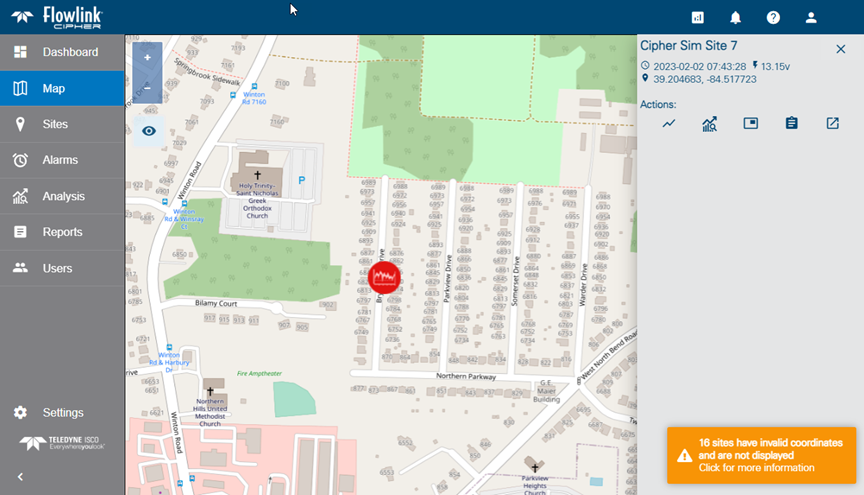
| The Map screen has been updated with new controls for zooming in and out of the view and for displaying inactive sites. Also, when the user selects a site symbol, a sliding panel now appears with information about the site and function buttons to generate a graph and to open the site information screen.
|
Scheduler | |
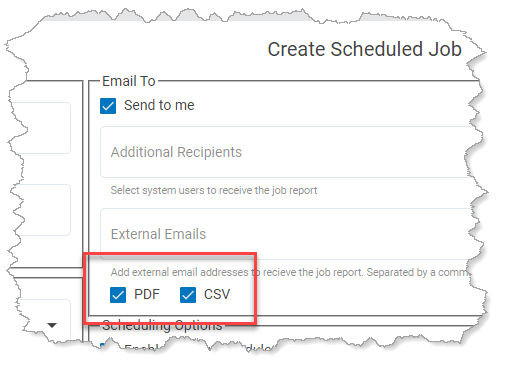
| The Scheduler now has options to create a PDF or a CSV output file, or both.
|
Maintenance
Flowlink Cipher
Alarms | |
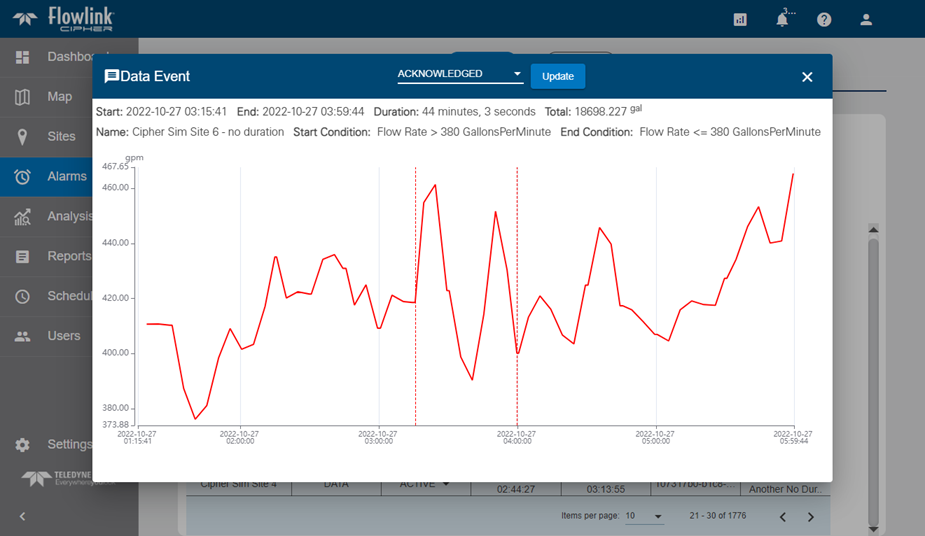
| The following changes have been made to the Data Event dialog box that contains the graph of data for a triggered alarm: - the Severity field was removed as it is no longer used - the End Condition is included with the Start Condition of the alarm setting that triggered the Data event - the end time is displayed as "Ongoing" when the End Condition has not yet been reached
|
Dashboard | |
| Previously, the Acknowledge Alarms function in the site gadget was limited to changing only 3 Data events from Active to Acknowledged. This has been fixed and the function will now Acknowledge all Data events that are currently Active for the site. It is important to keep in mind that a site that has at least one Data event that is Active or Acknowledged will still be displayed with a red color and the counter in the lower right corner of the site gadget will be the total of Active and Acknowledged Data events. The red color and the counter will not be removed until all Data events have been Resolved. |
| Refreshing the web browser after configuring a site gadget or graph gadget was causing the configuration to not be recorded and the gadget would appear empty after the refresh. This has been fixed. |
| In the battery gadget on the dashboard, the list of site names is now sorted in ascending order like site lists in the site and graph gadgets. |
General Application | |
| Previously the Submit Feedback function in the Help menu was not capturing a screen image correctly. This has been fixed. |
Graphs | |
| When creating a new graph in the Configure Graph screen, rapid changes to the graph layout, such as adding a new pane above the first pane, would sometimes freeze the application and stop the graph layout from being updated. This has been fixed. |
| Previously when using the manual editing tool to select and drag a point to change its value, the point would move only a short distance and then the function would stop. This has been fixed. |
| Creating a new graph using a template was failing if the template was defined with more than 1 dataset of the same type in the same pane. This has been fixed. |
| Previously when a note was added to a point, the point would need to be selected again before the Delete Note button was enabled. Now the Delete Note button is enabled as soon as the note is added, which allows the note to be deleted without re-selecting the point. |
Reports | |
| In the Reports > Templates > Public Templates panel, the table of public templates would not scroll properly as the number of public templates increased to require the ability to scroll the list. This has been fixed. |
Scheduler | |
| Users with only the Viewer role were able to access the Scheduler functionality. This has been fixed and access has been removed for users with only the Viewer role. |
Sites | |
| Previously there were instances in which a new site created in Cipher, by uploading a CSV file, was not correctly registered as a site in the system and would not appear as a new site card on the Sites screen. However, the site name would appear in the site selection lists for creating graphs as well as other functions. The site would also generate silent site alarm notifications. This problem has been fixed. |
| Users with only the Viewer role were able to modify the logs in the site information screen. This has been fixed and access to logs has been limited to read-only for users with only the Viewer role. |
User Accounts | |
| Users with the Administrator role, but not the System Administrator role, were incorrectly able to create new users and assign them the System Administrator role. This is no longer allowed. |
| When a user attempts to activate a new account from the link in the invitation email, but the account was previously created, a more helpful error message now appears: "Account already activated". |
1.4.0
October 2022
Enhancements
Flowlink Cipher
Alarms | |
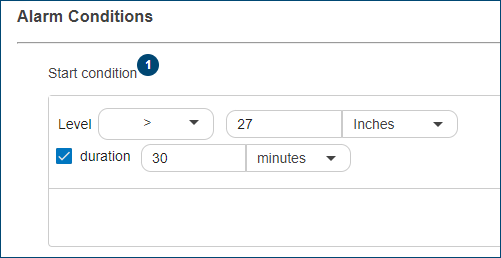
| The Configure Alarm page has been updated to include a new "duration" option. With this option defined, an alarm will not be triggered until the quantity exceeds the specified limit for at least the duration period. For Rainfall type datasets, the duration option is replaced with a "within" option which will not trigger an alarm until the accumulation of rain exceeds the limit within the specified time period.
|
Dashboard | |
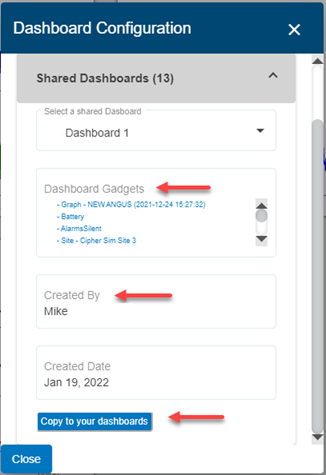
| The Dashboard Configuration dialog box has been updated to display more information about the shared dashboards that are available. When the user selects a shared dashboard, the list of gadgets available on the dashboard is displayed as well as the user that created the dashboard and the creation date. Also, the button to execute the function is now labeled as "Copy to your dashboards".
|
Events | |
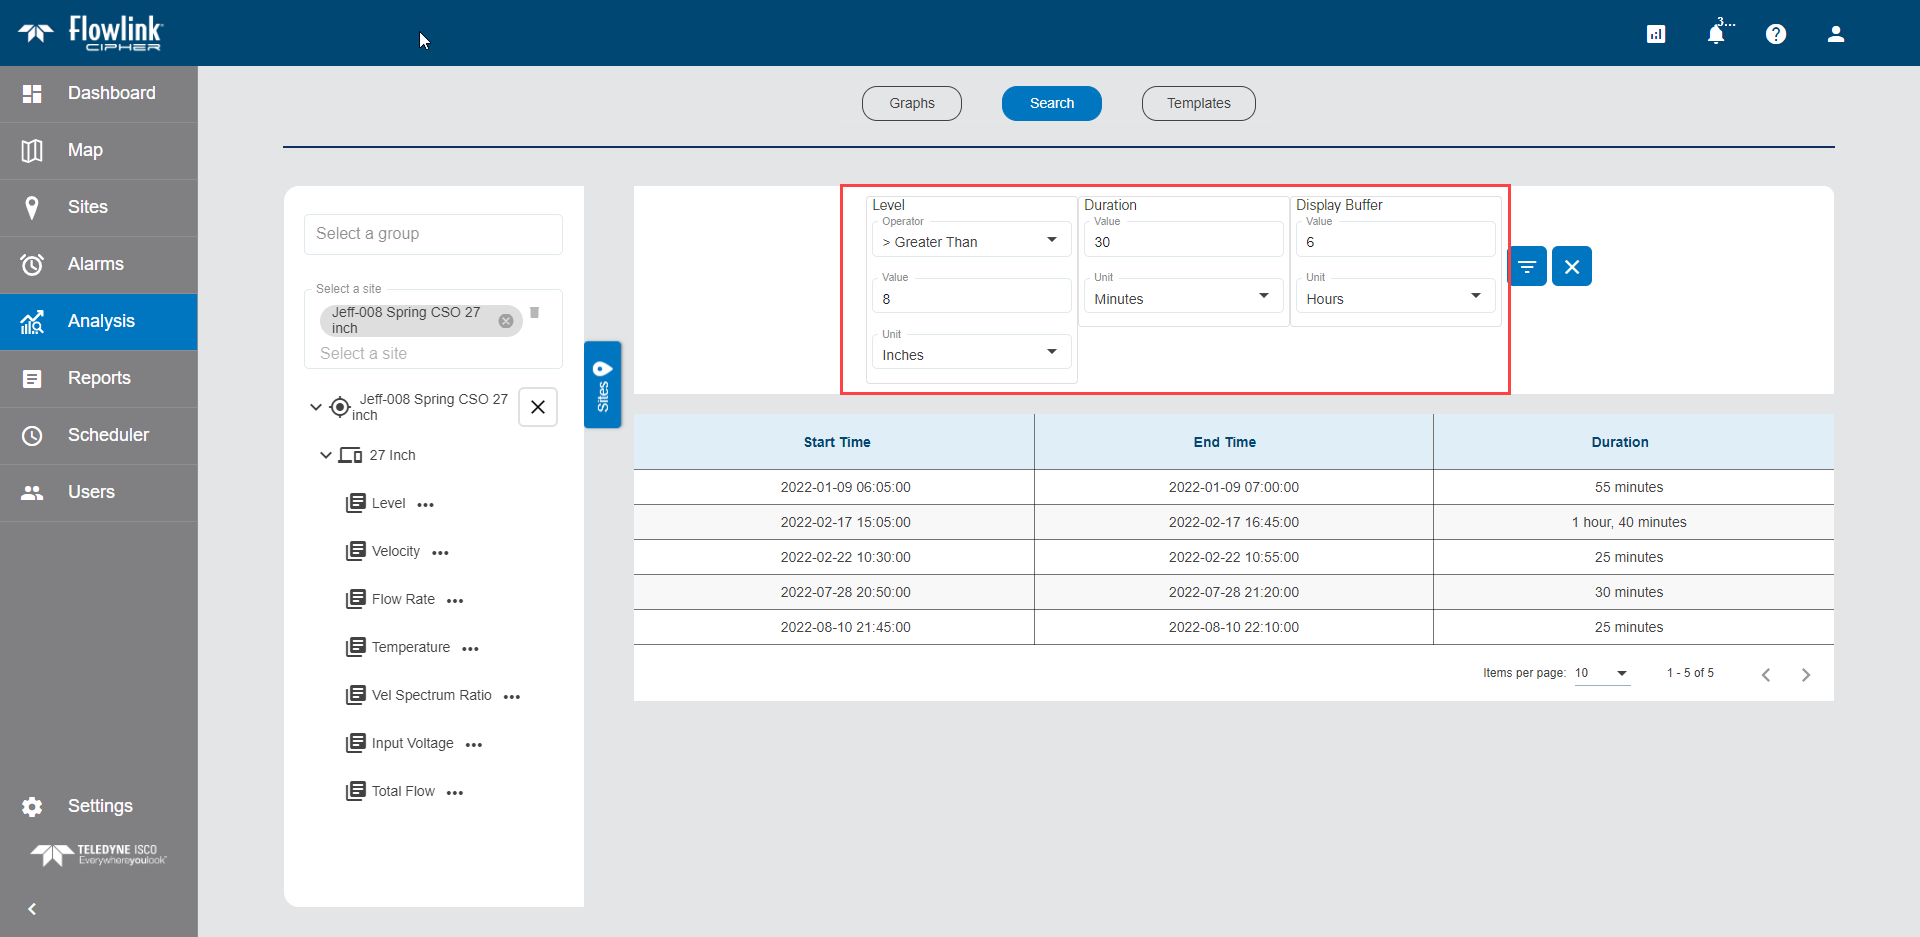
| The Search function on the Analysis screen now has a "Duration" option to search for events in previously ingested data that lasted for a specific amount of time. Specifying a duration can help eliminate detected events that are simply noise spikes in the measured data. For Rainfall data, the Duration option is replaced with a new "Within" option which will detect an event when the rain accumulation amount exceeded the limit within a time period.
|
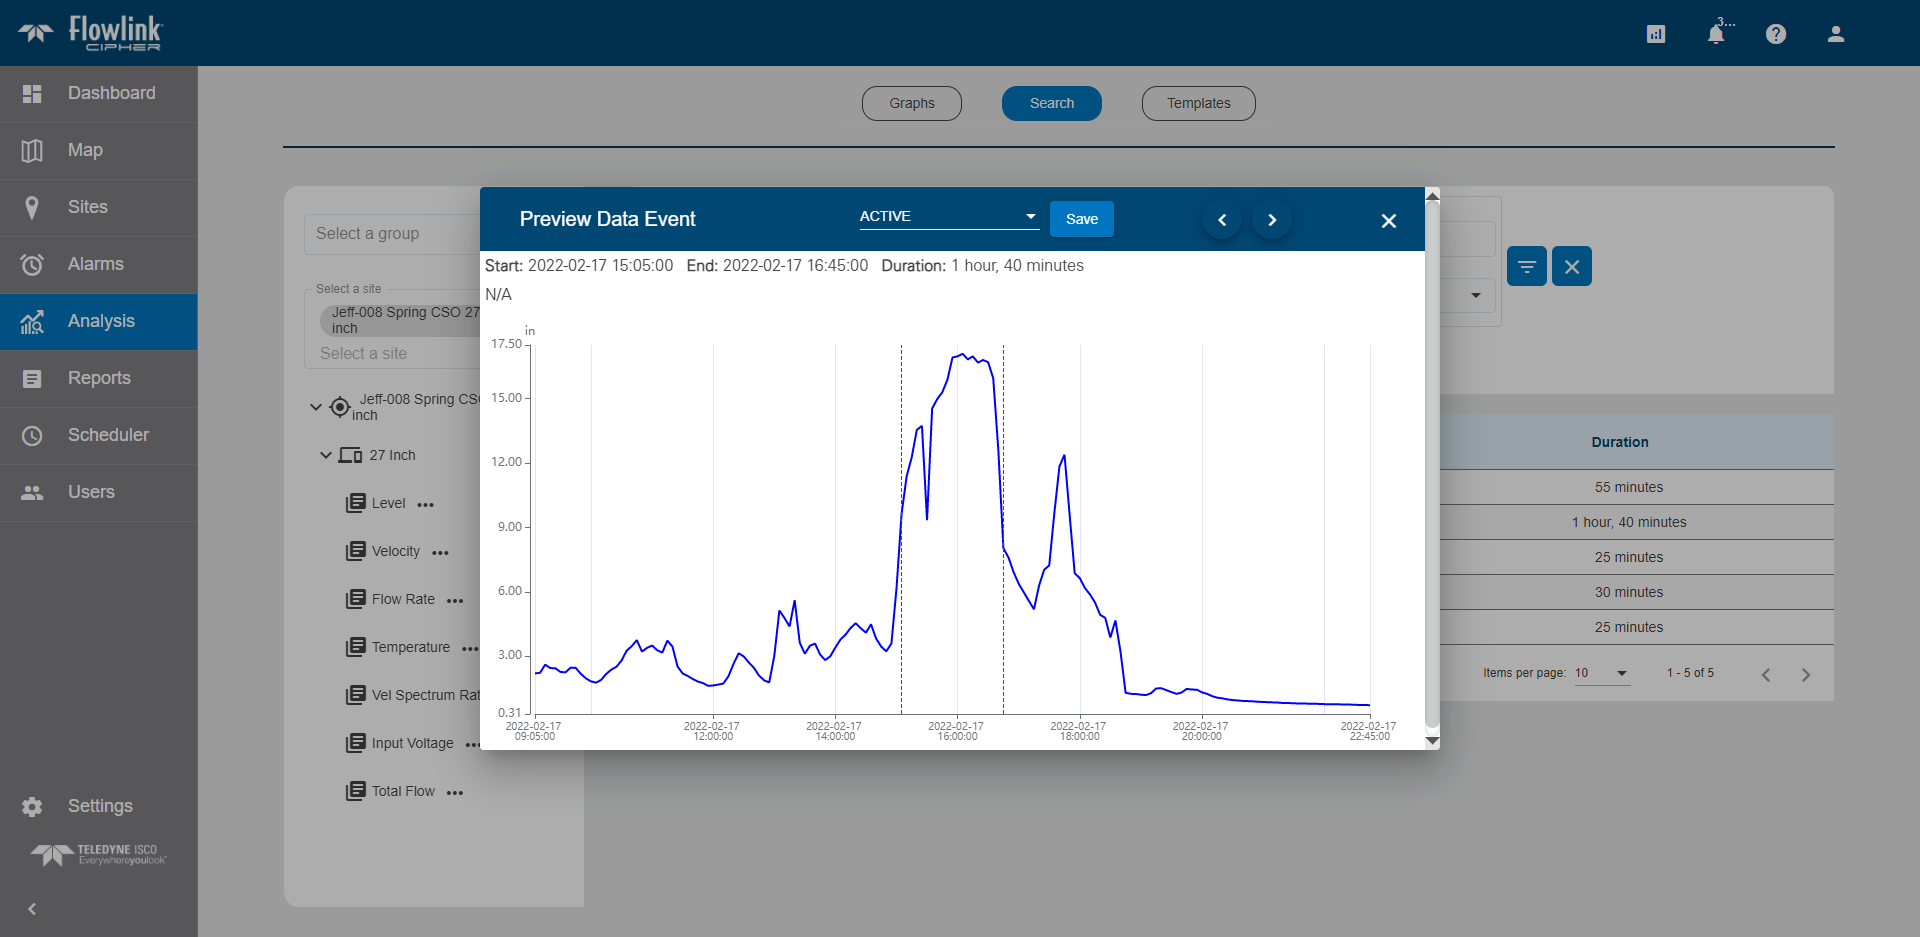
| The Preview Data Event dialog box is displayed when an event is clicked in the Analysis Search screen. It has been updated to include function controls to set the Status of the event if the user chooses to create a Data type event from the Search result. The dialog box also contains Preview and Next buttons for stepping forwards and backwards through the list of search results.
|
Graphs | |
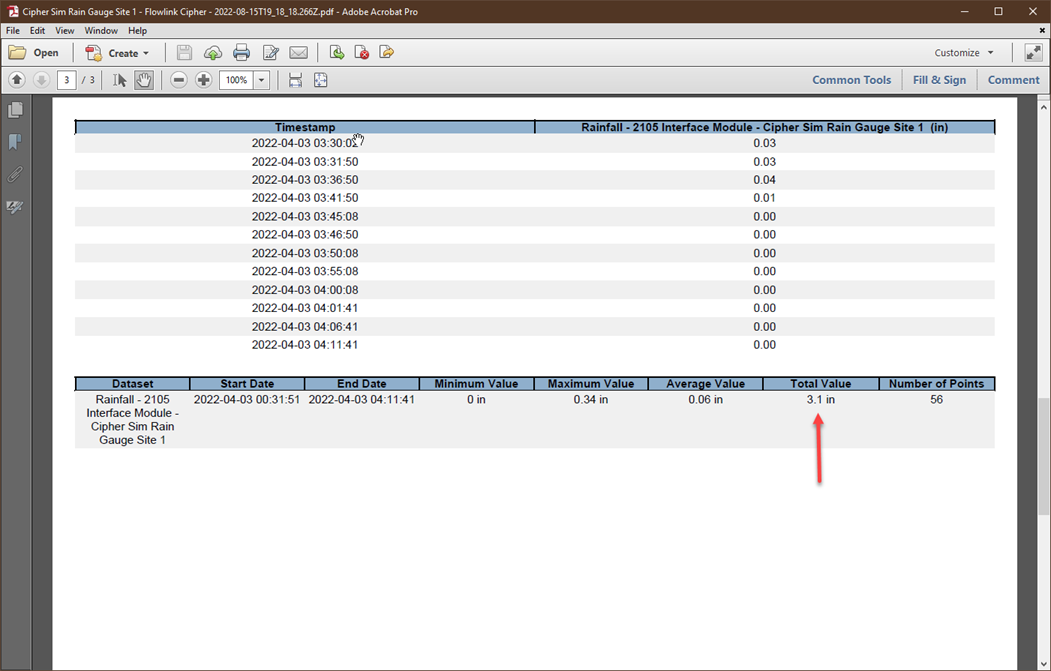
| The function 'Export graph to PDF' has been updated to include the Total value in the summary table at the bottom of the exported PDF. This is the same Total value that is in the graph's legend and at the bottom of the data table. This total value is important for the Total Flow and Rainfall quantities.
|
Settings | |
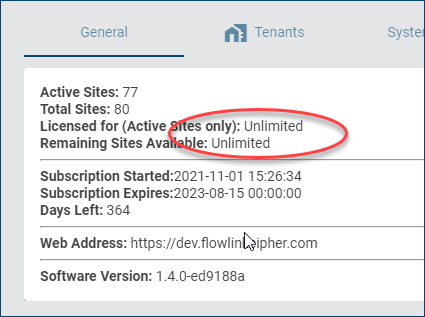
| On the General tab of the Settings screen, the value "Licensed for (Active Sites only)" will now display "Unlimited" when the customer has purchased an unlimited site license.
|
Tablet | |
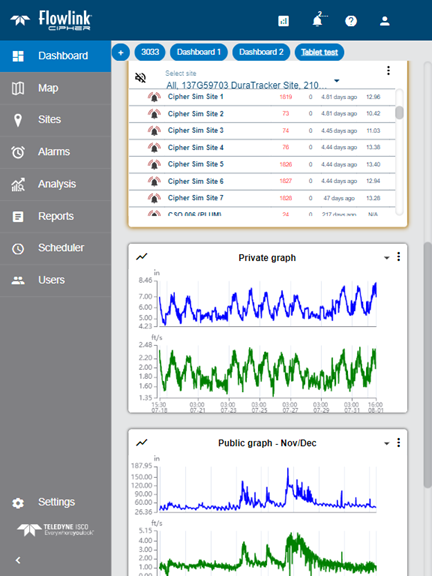
| The Dashboard screen would become unreadable when viewed on a tablet in the portrait orientation because the gadgets would be too small to display the data. This has been fixed and the Dashoard screen will now display with only one column of gadgets when viewed on a tablet in the portrait orientation, allowing the gadgets to remain at a size that will display the data.
|
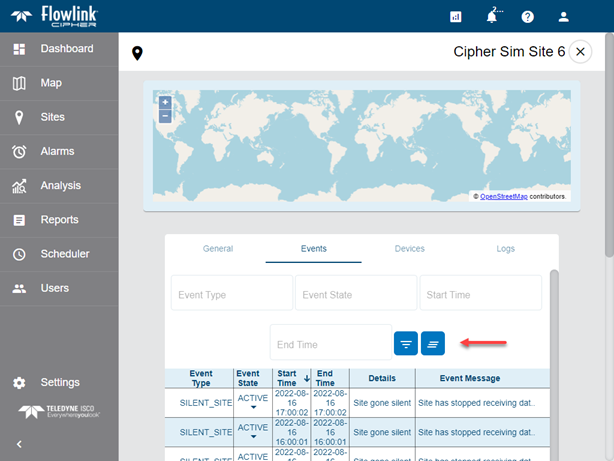
| The filtering fields on the Alarms and Reports screens, as well as the Events tab of the site information screen, are now visible on a tablet. Previously, these fields were not completely visible on a tablet, especially in portrait orientation.
|
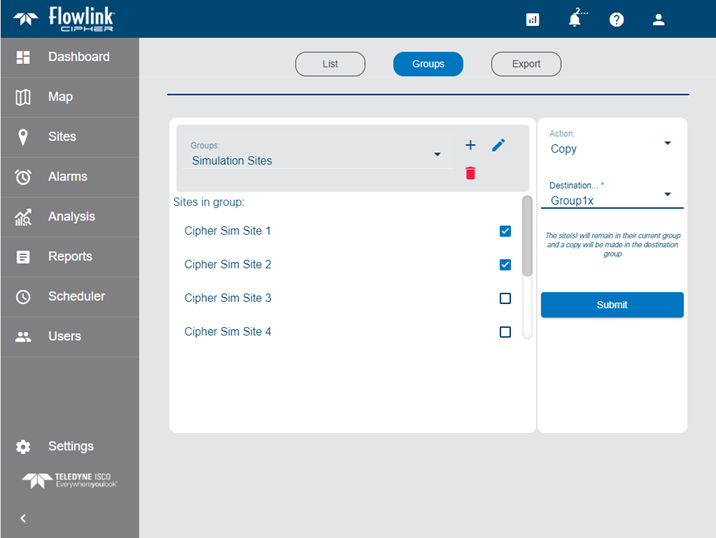
| The Sites > Groups screen has been redesigned for smaller screens on a tablet. Features on the screen include creating, renaming and deleting groups, as well as moving and copying sites into groups. To add a site to a group the user will select the site from the Unassigned list or from an existing group, then select the Move or Copy action, select the destination group and Submit the action.
|
User Accounts | |
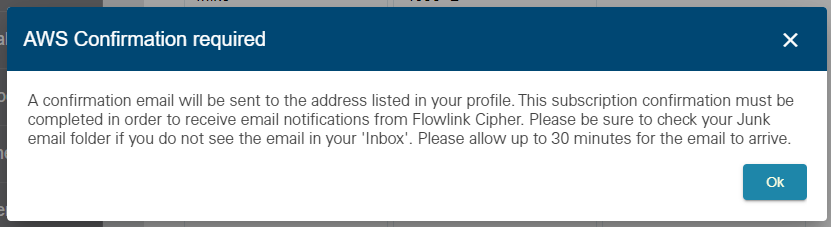
| Cipher now displays a message to the user when the user enables email notifications in the user profile. The message reminds the user that an email will be sent to the email address and the user must confirm the request for a subscription to the email service.
|
Maintenance
Flowlink Cipher
Dashboard | |
| Previously, when copying a shared dashboard there were cases where a graph gadget with a public graph would not appear on the new dashboard. Now, graph gadgets in copied dashboards will display public graphs and graphs that the user has access to that are present in the gadget, but will not display private graphs. |
Events | |
| Previously, when the user set the status of an event to Resolved, the End Time of the event would be updated to the current UTC time. This has been fixed as follows: - If the End Time is already set, when the user sets the status to Resolved, the End Time is not changed. - If the End Time has not yet been set because the event is ongoing, when the user sets the status to Resolved, the End Time is changed to the timestamp of the last point in the dataset. |
General Application | |
| An intermittent problem with the storage of the data has been solved. The problem would typically appear in the selection of static or relative time periods for graphs or reports. If the user selected the "All" option in graphs or reports, the data would be retrieved as expected for the function. However, if a static time range was defined or in some cases a relative time range, then no data could be retrieved. This root cause was found to be an indexing issue and is now solved automatically whenever new data is ingested to the site. |
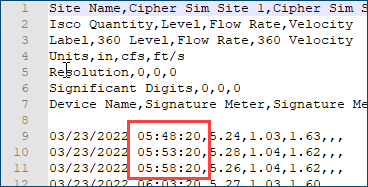
| Datasets exported to CSV files now contain seconds in the timestamps. Previously, the timestamps contained hours and minutes but not the seconds.
|
Graphs | |
| When the Display Total option is enabled in the display properties for a dataset, the computed Total value displayed in the graph legend now respects the Precision option also in the dataset display properties. This controls the number of digits to the right of the decimal point in the Total value. |
| The Zoom In function in the main graph screen now works as expected while the function is enabled. Previously, the function would work once and the button would remain enabled, but the user would be required to toggle the button off and on again to repeat the Zoom In behaviour. Now the Zoom In function can be repeated while the button is enabled. |
| In the main graph screen, the check boxes in the legend that enable the display of each dataset in the graph are now working as expected, specifically the dataset is displayed when the check box is checked on and not displayed when not checked. Previously, these controls were working in the graph configuration screen but not in the main graph screen. |
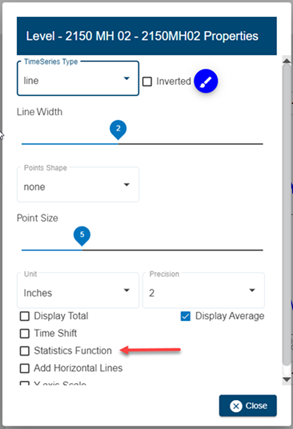
| Previously, when a new graph was created and the display properties dialog box for a dataset was opened, the "Statistics Function" option was turned on by default, which caused the display of the dataset in the graph to disappear when the dialog box was closed. This has been fixed. When a new graph is created, the "Statistics Function" option is now off by default. The user may then choose to enable the function and set the parameters for the function before closing the dialog box and updating the display of the dataset in the graph.
|
| Previously in the Configure Graph screen, the number of panes, and the datasets remaining in the panes, would become out of sync as the user added and removed panes in the graph or changed the placement of datasets in the panes. Now when the user removes all of the datasets in a pane, the pane is removed from the graph. If there is only one pane remaining in the graph, an empty pane will be left remaining in the graph. |
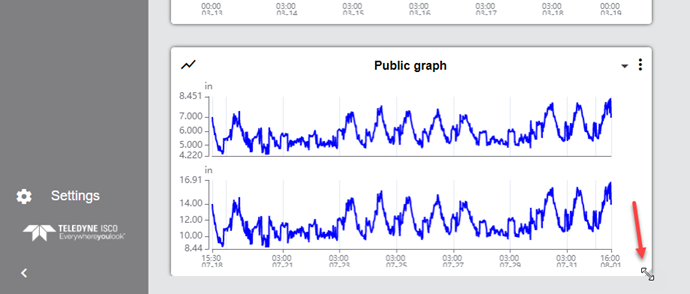
| The lower edge of gadgets at the bottom of the dashboard is now visible. This allows gadgets at the bottom of the dashboard to be resized by using the mouse to grab the handle in the lower-right corner of the gadget.
|
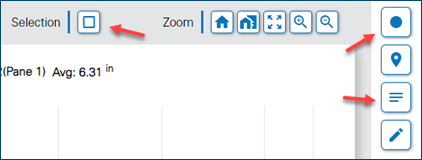
| Switching the Toggle Original Data button on/off in the main graph screen while the Select Points by Rectangle button was active was causing the Select Points by Rectangle function to stop working. Cipher now automatically disables the Select Points by Rectangle function when either the Toggle Original Data or Toggle Notes functions are turned on or off. This will signal to users that the Select Points by Rectangle function needs to be turned back on if they want to make further selections by rectangle.
|
| Previously in the Configure Graph screen, the pane numbers in the legend would become out of sync when the user added and removed panes in the graph or changed the datasets in the panes. The pane numbers in the legend are now updating correctly as datasets and panes are added or removed. |
Reports | |
| Previously, a user account that was assigned only the Viewer role was able to create new reports in the Reports screen. This is no longer allowed and the Create New Report button will not appear on the Reports screen for these users. |
Sites | |
| A problem has been solved with the display of the time since data was last received for some of the sites. The date/time of last received data on the site card and the elapsed time since data received on the site gadget on the dashboard are now correct. |
Tablet | |
| An Apple iPad tablet will not display a vertical scroll bar in the dataset tree of the graph configuration screen or the Computed Datasets screen. Small vertical lines now appear to the right of the dataset names to indicate that when the user touches to the right of those lines and moves up and down, the dataset tree will scroll. This is a characteristic of the iPad operating system, other tablets will display a vertical scroll bar.
|
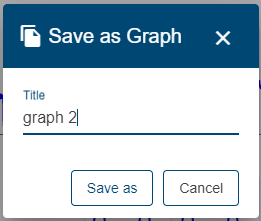
| The Save As Graph dialog box in the main graph screen was too small to be usable when viewed on a tablet. This has been fixed and the function can now be used on a tablet.
|
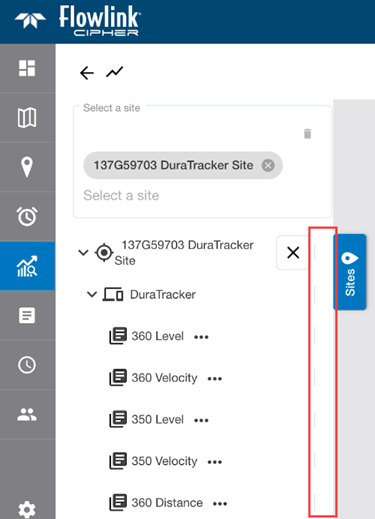
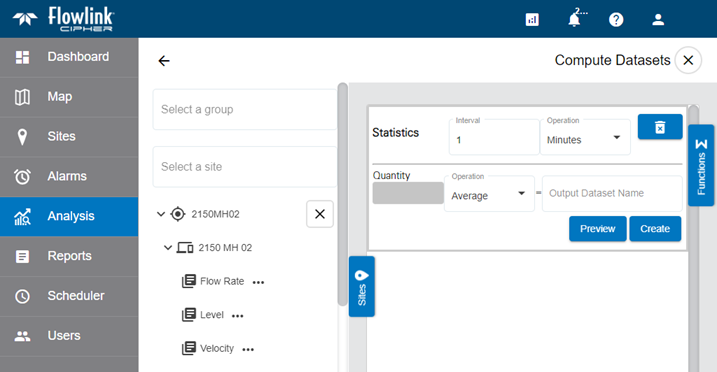
| When viewing the Computed Datasets screen on a tablet, the Sites button used to expand the site selection panel would partially cover the name and controls of the active function. The Sites button has been re-positioned to the center of the panel so that it is not regularly covering the function name and controls.
|
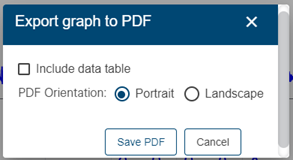
| The Export Graph to PDF dialog box when displayed on a tablet was too small to be usable. This has been fixed and the function can now be used on a tablet.
|
| When attempting to close the Configure Graph screen while working on a tablet, the dialog box displayed to prompt the user to save changes was too narrow to be viewed, especially if the tablet was in portrait orientation. The dialog box now displays in a more appropriate width when viewed on a tablet. |
| The Merge button on the Merge Datasets screen was not visible on a tablet unless the user scrolled down in the display. The Merge button has been relocated near the top of the screen where it will always be available. |
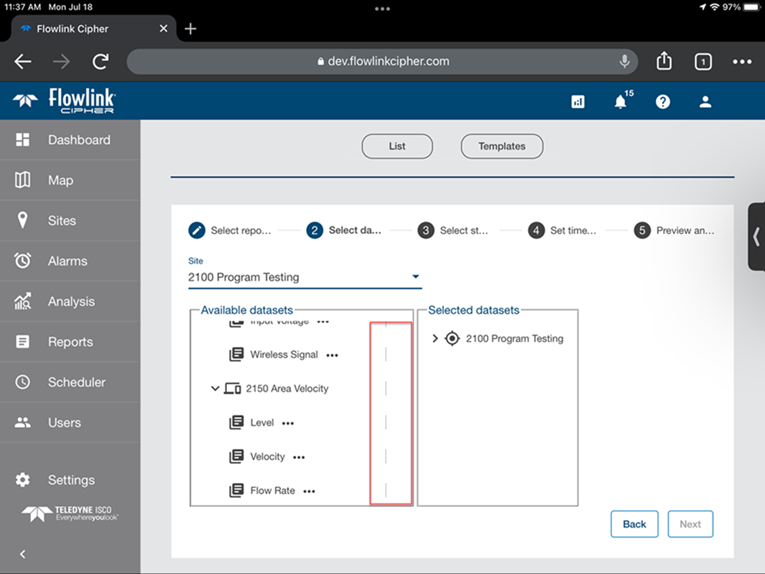
| An Apple iPad tablet will not display a vertical scroll bar in the dataset tree in step 2 of the Reports wizard. Small vertical lines now appear to the right of the dataset names to indicate that when the user touches to the right of those lines and moves up and down, the dataset tree will scroll. This is a characteristic of the iPad operating system, other tablets will display a vertical scroll bar.
|
| The Dataset Properties dialog box when displayed on a tablet was too narrow to be visible, especially if the tablet was in the portrait orientation. The dialog box is now displayed at a more appropriate width when viewed on a tablet. |
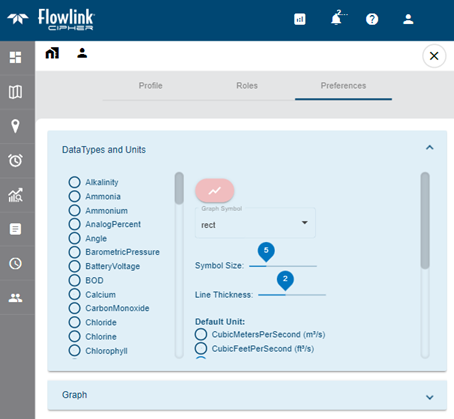
| Previously, the DataTypes and Units panel on the Preferences tab of the user Profile page was not able to display the names of the units when viewed on a tablet. The panel has now been re-arranged to place the list of units to the right or below the other display preferences so that the full names of the units are visible.
|
| When viewing the Alarms screen on a tablet, the "Filter events" and "Clear all filters" buttons may not have been visible. They have been moved and are now visible on a tablet.
|
Tenants | |
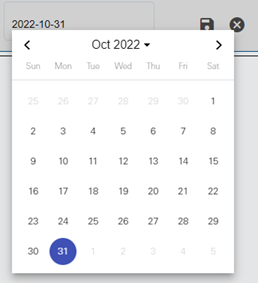
| In the Tenants tab of the Settings screen the user is no longer allowed to manually enter an Expiry Date using the keyboard. The date is now always selected from a date widget. The use of the date widget eliminates any prior problems with manually entering the correct date format.
|
User Accounts | |
| The new account setup procedure was failing when the user's operating system was not using the US English system setting. The link in the email from Cipher would fail to load the setup page and would go directly to the login page. This has been fixed. |


.png)