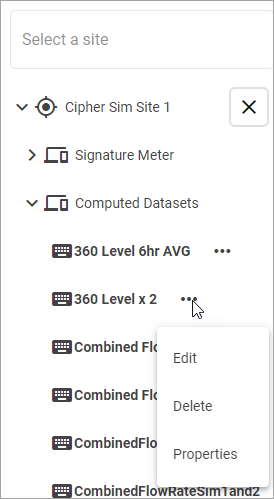
Flowlink Cipher 1.3
This section describes all changes made to the application in the 1.3 series of releases.
1.3.1
July 18
Enhancements
Flowlink Cipher
Dashboard | |
| The graph gadget on the dashboard now provides zoom and pan controls. To zoom the graph, hover the cursor over the graph and spin the mouse wheel. To pan the data in the graph, use the left mouse button to click and drag the graph left and right on the time axis.
|
| On the Dashboard Configuration dialog box, the "Shared" check box option is now used to indicate if the dashboard is to be shared with other users.
|
Graphs | |
| The interval labels on the Y-axis in the main graph screen, and the graph gadget on the dashboard, have been adjusted to avoid overlapping labels.
|
Maintenance
Flowlink Cipher
Alarms | |
| A problem in Flowlink Cipher 1.3 that was preventing an existing alarm setting from being modified has been fixed. |
| When filtering by site on the Alarms List screen the filtered list would retain the event list from the previous site when another site was selected and the filter executed. This has been fixed and the filter now displays the events for the current site. |
Computed Datasets | |
| Selecting the Edit command from the ellipsis menu of a computed dataset in the Site Selection list was causing the user to be logged out of the application. This has been fixed. The Edit command will now open the function that created the dataset as expected.
|
Dashboard | |
| The graph gadget on the dashboard now lists the available graphs in alphabetical order. |
Events | |
| Silent Site events and email notifications will no longer be received from inactive sites. |
General Application | |
| Pressing and holding the Ctrl key while clicking an item in the left sidebar menu will now open the page as a new tab in the web browser. |
Graphs | |
| The Zoom Out function in the main graph screen is working again. To use this tool: - Enable the function by clicking the Zoom Out button or pressing 'x' on the keyboard. - Click on the graph. The graph will zoom out by an amount that is equivalent to rotating the middle mouse wheel by one click. |
| The X-axes of all panes in a graph will now be correctly aligned when one pane has more Y-axes on the right end than other panes.
|
Reports | |
| Older stored reports which may not have been correctly identified with a tenant could not be deleted. This has been fixed and these reports can now be deleted. |
Scheduler | |
| The Job Scheduler is now sending emails to users as expected. Previously, when several reports were generated at the same time, some of the emails were not sent as expected. This has been fixed. |
1.3.0
April 27
Enhancements
Flowlink Cipher
Computed Datasets | |
| The Output Dataset Name for all computed datasets must be unique in the Cipher database. All Compute Dataset functions will now display an error message when a user enters an output name that is already in use. Note that dataset names are not case sensitive, therefore "flowrate" is the same as "Flowrate" and "FlowRate". |
Events | |
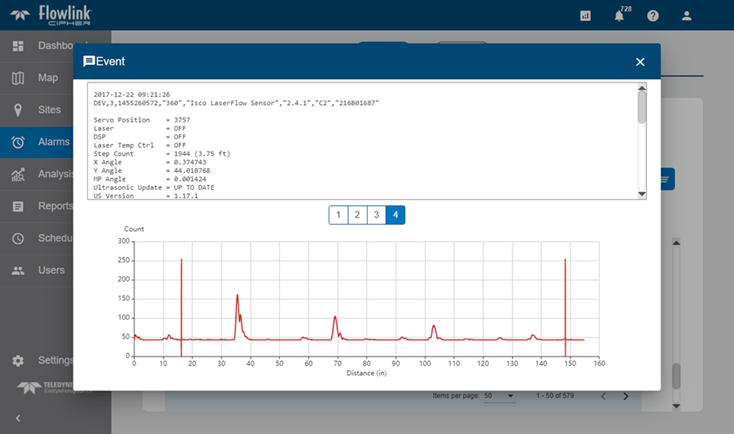
| Diagnostic events ingested into Cipher are now rendered in a new dialog box with both text and graphs displayed. The diagnostic events are available in the Alarms screen and the Events tab of the site information screen.
|
Export | |
| The "Select site" and "Time interval" controls in the Export tab of the Sites page have been updated with validation of the user input before the function can be executed. |
General Application | |
| The Error Correction control on the main graph screen has been renamed as Data Handling. The Data Error Handling option in the user preferences has also been renamed as Data Handling. |
Graphs | |
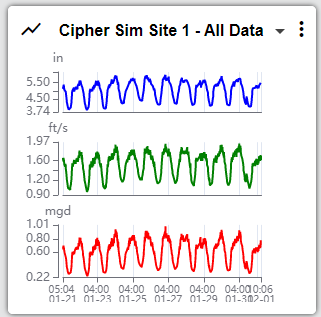
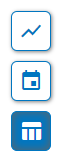
| The graph will now remember the on/off settings for the "Toggle Graph", "Toggle date toolbar", and "Toggle data table" tools in the toolbar on the right side of the main graph screen. For example, if only the table is displayed when the graph is closed, then the next time the graph is opened only the table will be displayed. Also, when the graph is closed with only the table displayed, the graph tile on the Analysis screen will now display a generic image of a table instead of an image of a graph.
|
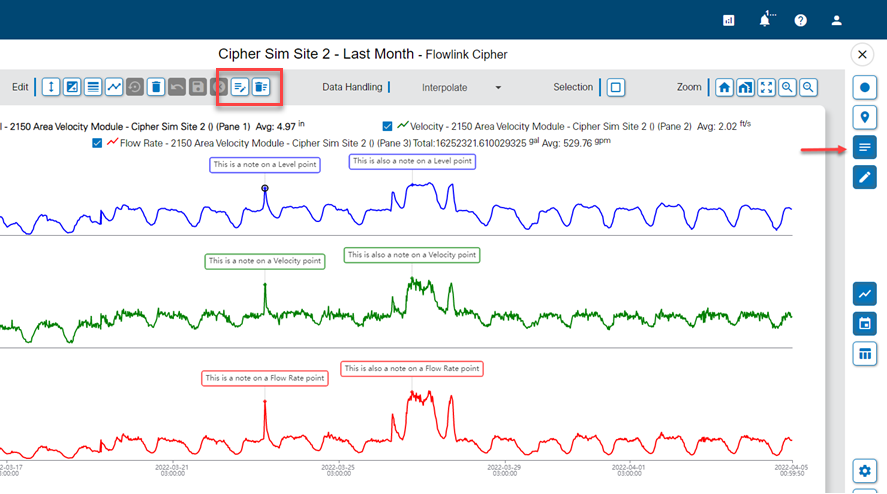
| Notes can now be added to a graph in the main graph screen. To add a note, put the graph into Edit mode, select a point and use the Add Note button on the Edit toolbar. Use the Toggle Notes button to enable the display of stored notes. Each note is attached to one point in the dataset. A point that has a note will be displayed with a diamond shape. Hovering the cursor over a point that has a note will display the note even if the Toggle Notes tool is not turned on. Notes will appear in any graph that includes the dataset to which the notes were added. When a point with a note is selected, the Edit Note and Delete Note functions can be used to change the text of an existing note or delete the note.
|
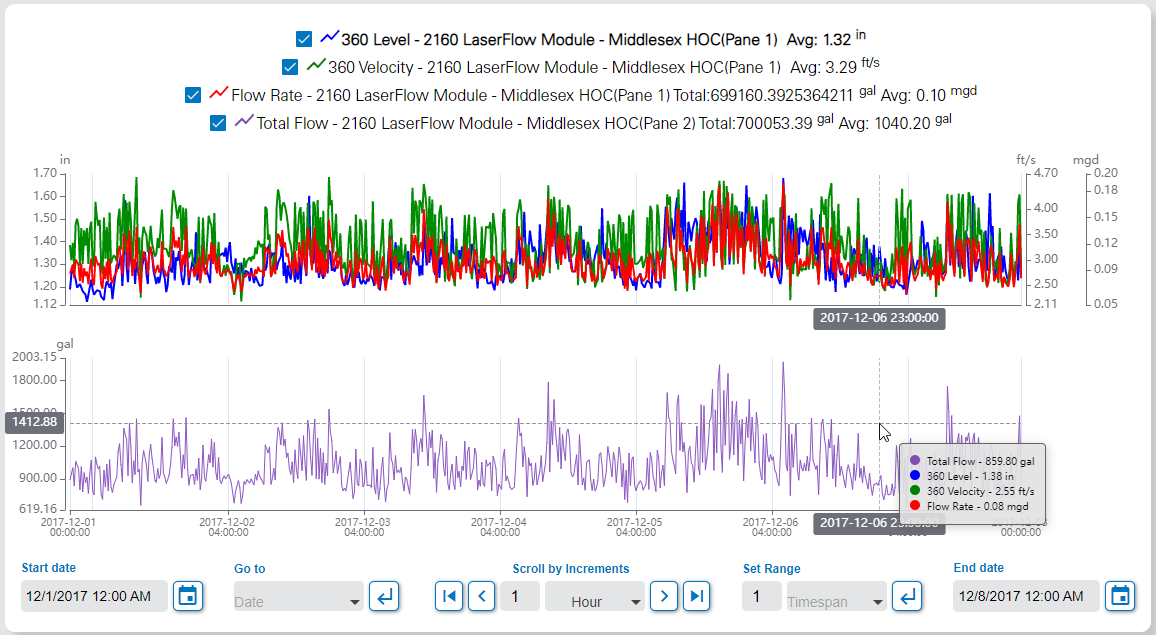
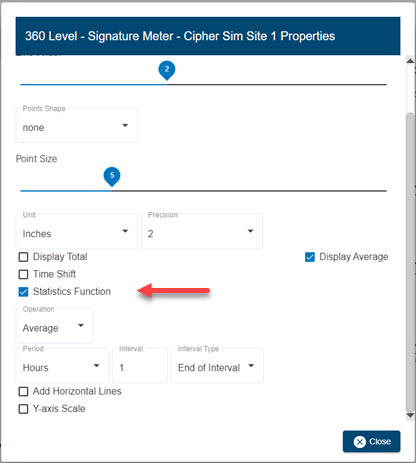
| The display properties for each dataset in a time series graph now includes an option to apply a statistics function to the data. Statistics function options include Average, Minimum, Maximum and Sum. For Flow Rate datasets, the Volume function is available instead of Sum.
|
Reports | |
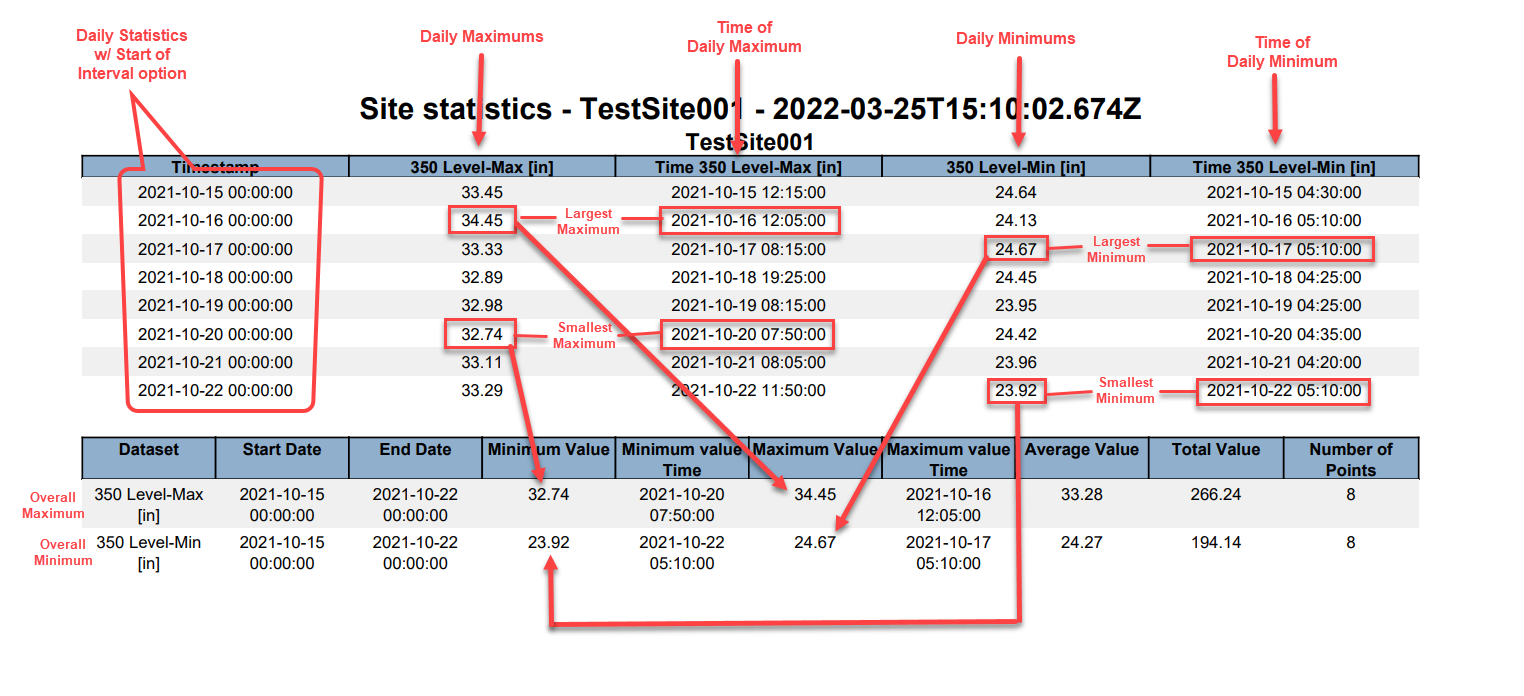
| Selecting Minimum or Maximum for a Site Statistics report will now display the specific data points for Minimum and Maximum and their timestamps within each statistical interval in the report. In the report summary the overall Minimum and Maximum values with their timestamps will also be included.
|
Sites | |
| The thumbnail pictures of the devices that appear in the Devices tab of the site information screen have been updated. |
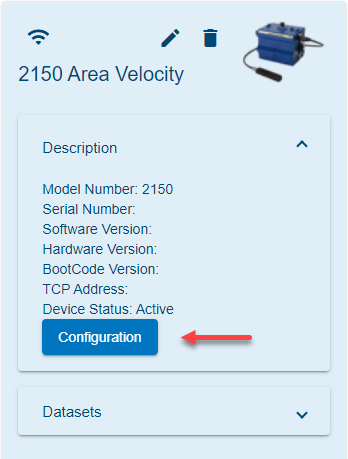
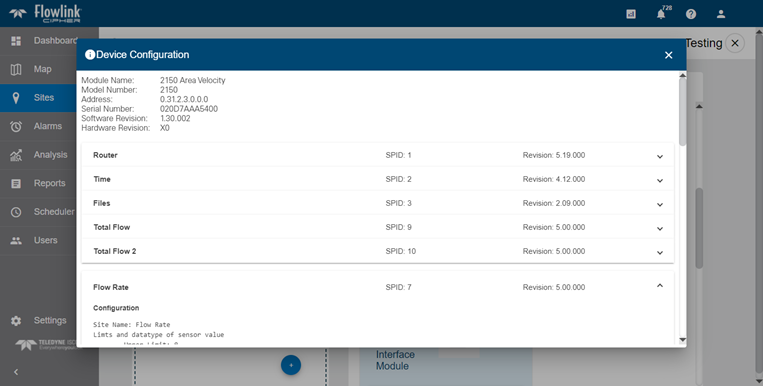
| The program information for 2100 series devices can now be accessed with the new Configuration button on the device tile in the Devices tab of the site information screen.
|
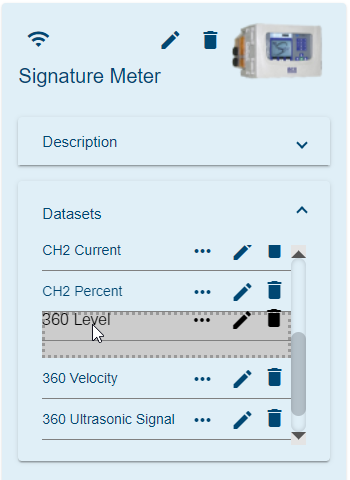
| The user can now create a preferred sorting of the datasets for each device. This is available on the device tile in the Devices tab of the site information screen. The user can drag-and-drop the datasets up and down in the list. The sort order will control which Level, Velocity and Flow Rate type datasets are automatically selected for use in the site gadget on the dashboard and in a new graph when using the Level, Velocity and Flow Rate quick graph function on the site card.
|
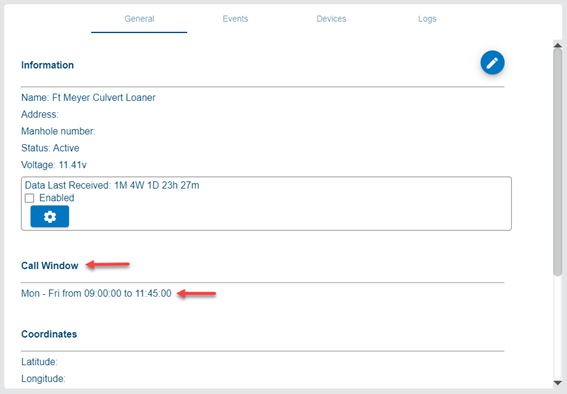
| The General tab of the site information screen now has a Call Window section. This section displays information about the next available call window configuration, or 'Not available.' if none was found.
|
Maintenance
Flowlink Cipher
Dashboard | |
| The data alarm count badge and red glow around site gadgets on the dashboard will now correctly update automatically on the refresh interval of the gadget. |
Export | |
| The Sites > Export function is now using the Data Handling setting in user Preferences when exporting site data. Previously, the exported data was being exported without any adjustment that may have been required by the Data Handling setting. |
General Application | |
| The "Select a group" and "Select a site" controls in the Configure Graph screen have been improved. When the user selects a group to filter the site list, the name of the selected group remains visible and the site list is filtered to show only the sites in selected group. More groups can be selected and the site list will expand to include sites in those groups. Each group can be de-selected, which removes that group's sites from the site list. When all of the groups are de-selected, the site list displays all sites again.
|
Graphs | |
| In the display properties dialog box for a dataset in a graph, the user can now highlight and enter new values in the Maximum, Minimum and Interval fields of the Y-axis Scale options. Previously, the highlighting of an existing value would not allow a new value to be entered without first removing the existing value. |
Reports | |
| When editing a template, the list of available datasets is now populated with datasets that match the dataset type defined by the template. Previously the list of available datasets was not populated, which required the user to re-select the datasets. |
| A user who is assigned to a tenant will now only have access to stored reports generated for sites that are in the same tenant. Previously a user in a tenant could see all reports that were stored and displayed in the Reports > List screen. |
| In the Site Statistics report the Minimum value Time and Maximum value Time fields in the summary table now have the correct date/time of the minimum and maximum values in the table. Previously the Minimum value Time and Maximum value Time fields incorrectly used a UTC time zone offset. |
Sites | |
| The color of the site icon on the Map screen will now correctly match the color of the icon on the inset map in the site information screen. |
| Filtering events by the event status is now working as expected in the Events tab of the site information screen. |
Tenants | |
| When activating the Tenants system for a new Cipher instance, the Confirm and Cancel buttons on the confirmation dialog box now work as expected. Previously the buttons were reversed. |