Computed Datasets | |
| The function "Flow Conversion" has been renamed to "Data Points: Level to Flow". The function "Flow Area Conversion" has been renamed to "Data Points: Level to Area". |
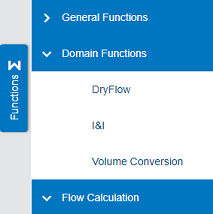
| A Volume Conversion function has been added to the Computed Datasets screen. This function takes a Flow Rate dataset as input and computes a volume for each input data point. The output volume dataset can then be used in the Statistics function or in a Site Statistics report to produce total flow values at a user-specified interval.
|
| The Computed Datasets screen now offers eight different functions for computing a new Flow Rate dataset.
|
Dashboard | |
| A dashboard can now be shared with other users. Each dashboard now has a private / shared control. The Dashboard Configuration dialog box provides a list of Your Dashboards and Shared Dashboards. When a dashboard is shared, other users can select it from a list and create their own copy of the dashboard. This copy can then be modified for their purposes without affecting the original copy of the dashboard maintained by the owner.
|
| The functions for adding gadgets to a dashboard as well as adding, deleting and renaming dashboards have been improved. Buttons for switching between existing dashboards now appear at the top of the dashboard screen. A new menu provides functions to add gadgets, add a new dashboard and rename a dashboard.
|
Export | |
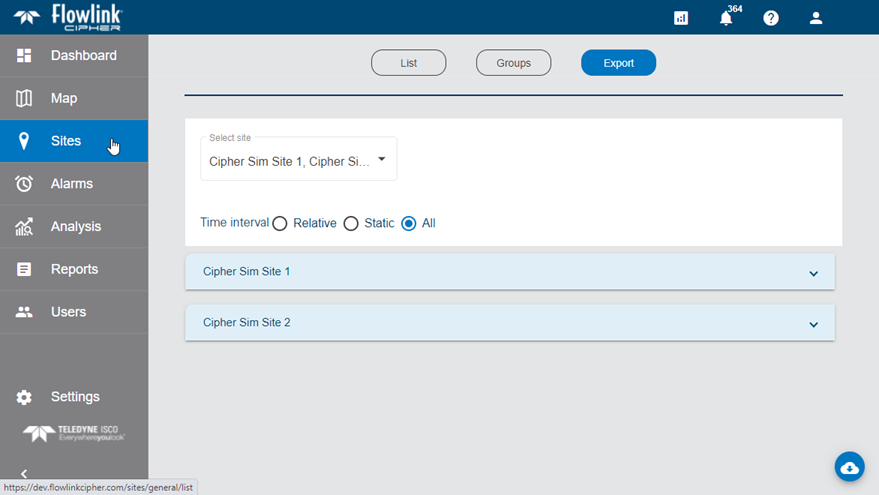
| Cipher now has a new Export tab on the Sites screen. This process allows the user to select one or more sites to export data points to a Cipher CSV file. Options are provided to select the datasets to export as well as units, precision, and the time range for the data to be exported. Each site is exported to its own CSV file. When multiple sites are exported, the CSV files are combined into a ZIP file.
|
General Application | |
| The fields for filtering the table of events on the Alarms screen and the Events tab of the site information screen are now the same: Site, Event Type, Event State, Start Time, End Time. |
| The columns that appear in the table of events on the Alarms screen and the Events tab of the site information screen are now the same: Site, Event Type, Event State, Start Time, End Time, Details, Event Message. |
Graphs | |
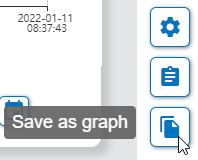
| The toolbar of the main graph screen now has a "Save as graph" function for saving the existing graph as a new graph with a user defined name. The new graph will open in edit mode to allow the user to modify the graph as needed before completing the creation of the graph.
|
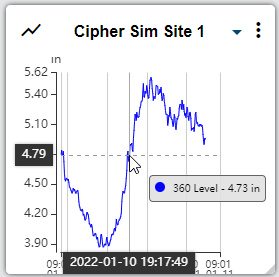
| Error codes are now displayed in the tooltip when viewing a graph in the main graph screen, and in the tooltip in the graph and site gadgets on the dashboard. The error codes are also displayed in the table in the main graph screen.
|
| Site and device names have been removed from the tooltips in the main graph screen as well as the tooltips in the graph and site gadgets on the dashboard. This improves the readability of the tooltip and reduces the clutter in the graph, especially on smaller screens.
|
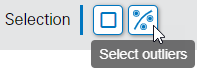
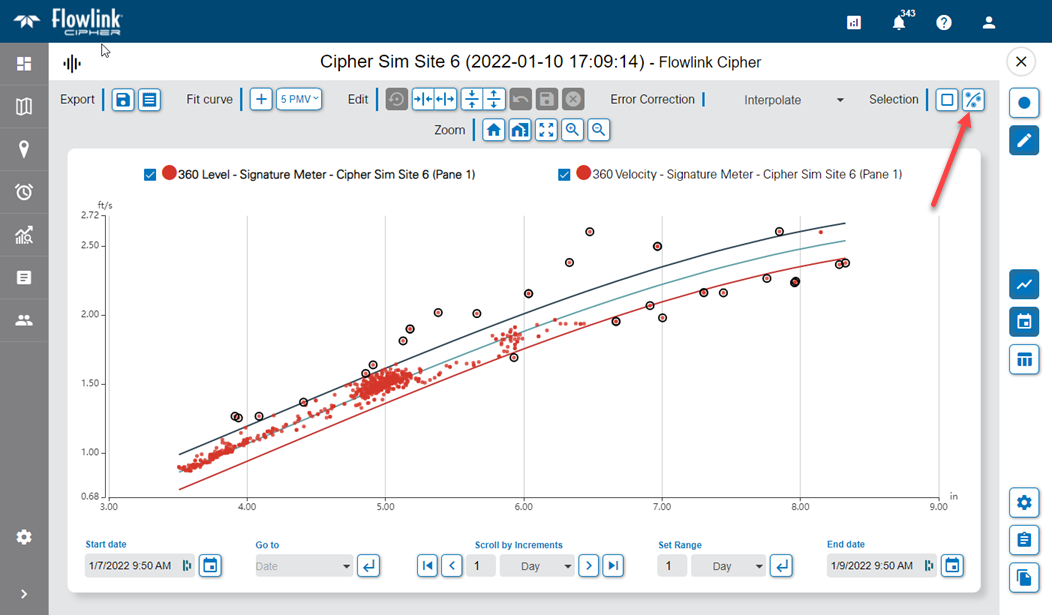
| When a scatterplot is in Edit mode, a new Select Outliers toolbar button is available. When a best fit curve has been added to a scatterplot, the Select Outliers function will select all of the points that fall outside of the curve's limit lines.
|
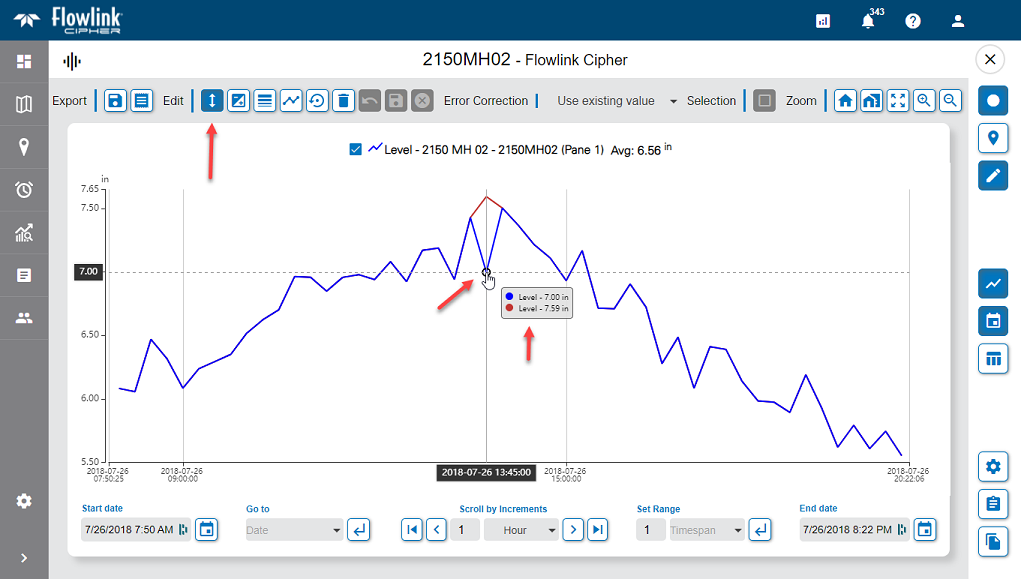
| A new Manual Edit function has been added to the Edit toolbar on the main graph screen. To use this new function: - Enter edit mode. - Select a single point. - Click the Manual Edit button. - Using the mouse, click and drag the point up or down. As the point is dragged to a new value, the cursor tooltip and the Y-axis tooltip will display the value.
|
Logging | |
| When a user account is assigned to a tenant, the entry in the System Log in the Settings screen has been updated to indicate which user account was changed and the account's new tenant. |
| A reports-log.log file is now available in the Logs tab of the Settings screen. This new log will contain messages relating to report generation by a user or from the scheduler system. |
| The System Log now contains an entry when a new user account is created and when the account setup was completed by the new user. |
| The entries in the System Log and the site Logs are now appended with the label (UTC) as a reminder to the users that the log entries are UTC and not the time zone of the user or the device. |
Reports | |
| The PDF output from the Site Statistics report and the Basic Health report now uses landscape orientation instead of portrait orientation. Both reports have several columns of information and are now more readable in landscape orientation. |
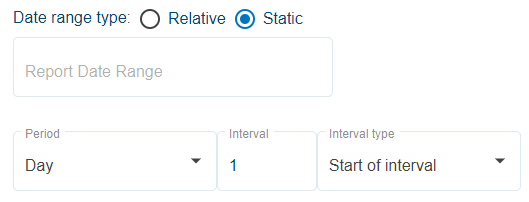
| The default time interval in step 4 of the Site Statistics Report has been changed to 1 Day. Previously the default was 15 minutes.
|
| The Site Statistics report now includes the values "Minimum Value Time" and "Maximum Value Time" in the summary table at the bottom of the report. These represent the date and time of the minimum and maximum statistical values, for each statistic, included in the report's table. |
Scheduler | |
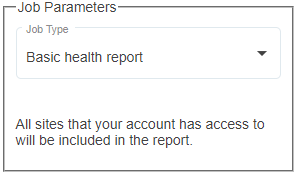
| The new Scheduler tool includes the option to generate a basic health report. The job does not require selecting any additional parameters. All sites that your account has access to will be included in the report.
|
| Flowlink Cipher now provides a Scheduler tool that can be used to generate site statistics and health reports on recurring time intervals. The reports are sent by email to the user account that created the scheduled job, by default, and optionally to other user accounts in Cipher or external email addresses.
|
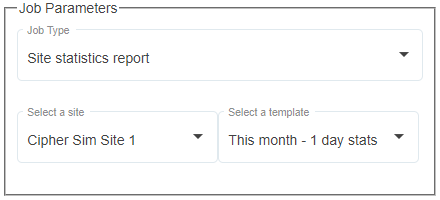
| The new Scheduler tool includes the option to generate a site statistics report. The job requires selecting the site and a reports template that defines the preferred quantities, statistics and time period.
|
Sites | |
| The Data Import Utility in the Sites screen now supports the DDP file format. |
User Accounts | |
| The Data Error Handling option for graphs will now be set to Interpolate by default for new user accounts added to Cipher. This option can be found in the Preferences tab of the user profile screen. |
| A new user who has received an email with the invitation to register their account now has one week to respond. Previously the registration needed to be completed within 24 hours. |