Graphs | |
| The Configure Graph screen will no longer duplicate the panes in the graph and the dataset names in the legend. |
Flowlink Cipher 1.1
This section describes all changes made to the application in the 1.1 series of releases.
1.1.3
January 10 2022
Maintenance
Flowlink Cipher
Graphs | |
| The Configure Graph screen will no longer duplicate the panes in the graph and the dataset names in the legend. |
1.1.2
December 23 2021
Enhancements
Flowlink Cipher
Alarms | |
| The Alarms screen and the Events tab of the site information screen provide a table of events that were either ingested into Cipher or generated by Cipher. Events of the type ALARM represent alarms that were triggered by a device and ingested into Cipher. The table of events can now be filtered using this event type. |
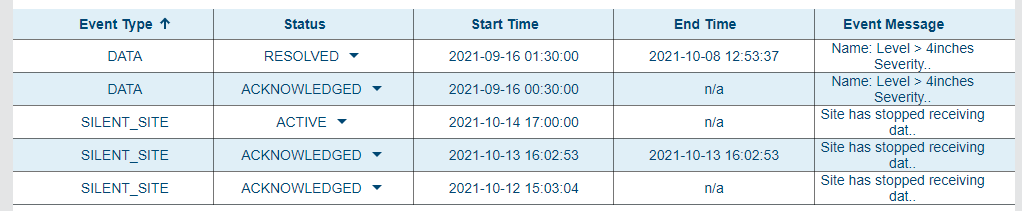
| The following changes have been made to improve the reporting of alarms: - Alarms that are triggered in a device and ingested into Cipher will now appear in the Events tab of the site information screen as ALARM type events. - Alarms that are triggered by alarm settings in Cipher will now appear in the Events tab of the site information screen as DATA type events. - ALARM events in the Events tab now use the 3-stage lifecycle of ACTIVE > ACKNOWLEDGED > RESOLVED. - The total count of both ALARM and DATA type events now appears in the Alarms gadget on the dashboard. |
Dashboard | |
| A Battery gadget added to the dashboard is one cell wide by default. In instances where a site name is long, the Voltage value was not visible with the default sizing. This has been fixed to always display the Voltage value. |
Sites | |
| The filtering options in the Sites screen are now remembered during the session and the filter panel will now remain open during the session. |
| The Logs tab in the site information screen has been upgraded with several new log entries. The new log entries include, but are not limited to the status of an event being changed, or a user editing a part of the site metadata, a site's tenant or the active/inactive state of the site. |
| The list of sites, as seen in the Sites screen and various drop-down lists containing a list of sites, will now automatically update when new sites are created in the system. |
Tenants | |
| When adding an Alarm, Silent Site or Battery gadget to the dashboard, only Global users will be able to select the option for sites in a tenant. Previously, this option was available to users in a tenant which is not correct as users in a tenant have access only to those sites in their tenant. |
Maintenance
Flowlink Cipher
Alarms | |
| Once an alarm setting has triggered an alarm, the setting cannot be modified because it provides the definition of the triggered alarm recorded in the database. In some cases, a setting that had not yet triggered an alarm could not be modified due to a problem that has now been fixed. |
Dashboard | |
| The Graph from Site function in a site gadget will now start a new graph using the same datasets that were selected in the gadget for Level, Velocity, and Flow Rate. Previously, if the user selected a different L/V/F dataset in the site gadget, the Graph from Site function may not have started the graph with the same datasets. |
| Clicking on a site name in an Alarms gadget will now open the site information screen with the Events tab selected, displaying the alarms in a table. |
| Selecting the New Dashboard function was causing two entries to be created in the dashboard list with the name "New Dashboard". This has been fixed. |
| The sorting of the data in the Alarms, Silent Site and Battery gadgets is now maintained while the dashboard screen is open. Previously, when the gadgets would automatically refresh, the sorting would revert to a default sort. This has been fixed. |
Events | |
| On the Events tab in the site information screen, the event type filter option for "Sample" will now find the Bottlesample events. Previously, the option for "Sample" was not finding the Bottlesample events. |
Graphs | |
| When using the Level, Velocity and Flow function on a site card to create a new graph, if the site did not have Velocity data, the two resulting graph panes would be labeled as Pane 1 and Pane 3 instead of Pane 1 and Pane 2. This has been fixed. |
| Creating a new graph from the Level, Velocity and Flow Rate function on the site card is no longer labeling all of the datasets as (Pane 1) in the graph's legend. Also, repeated use of the Graph from Site function in the site gadget's menu is no longer duplicating the device name in the graph's legend or duplicating datasets in the graph. |
| The Auto Correct edit function in the main graph screen has been reverted to a previous implementation. The function now adjusts the value of the selected point by averaging its neighbors. |
Map | |
| The color of the site icon in the map panel on the site information screen is now matching the color of the site icon on the main Map screen. Previously, the color of the icon in the site information map panel was not matching the main Map screen in some cases. |
Reports | |
| The SUM statistic for Rainfall dataset types in the Site Statistics report is now computed correctly as a simple sum of the values in the interval and a total of the sums at the bottom of the report. |
Sites | |
| Edits to the metadata of a site in the site information screen, such as the site tenant, are now being saved correctly. Previously, in some cases a red error message would be displayed when attempting to save edits. A related problem would also cause a site to be duplicated when new data was ingested if the metadata of the site was different than the metadata of the new ingested site data. This problem has also been fixed. |
| Frequent updates were being sent to site cards on the Sites screen when Cipher was ingesting data. If a user had the drop panel expanded for a card at the time that an update was received, the panel would automatically retract. This has been fixed by reducing the frequency of site card updating during data ingestion. |
1.1.1
November 2 2021
Maintenance
Flowlink Cipher
Sites | |
| The site count that appears on the Sites screen will now match the site counts that appear on the Settings screen. When the display of inactive sites on the Sites screen is off, the site count of active sites will match the Active Sites count in Settings. When the display of inactive sites is on, the site count of all sites will match the Total Sites count in Settings. |
| The Forgot Password function on the Cipher login screen is now working again. |
1.1.0
November 1 2021
Enhancements
Flowlink Cipher
Alarms | |
| Computed datasets can now be used when defining conditions for triggering alarms. Previously only measured quantity datasets could be used for alarm conditions. |
API | |
| The following fields were renamed in the Quantity Retrieval API: - primaryUnit is now unit - primaryDataType is now dataType. |
| Fields with null values are no longer returned from the API. |
| Site export in the API now includes altitude, connectionString, and quantity status fields in the responses. |
| The fields createdAt, updatedAt, and status are no longer returned from the device retrieval API. |
| The date format used in the API has been changed to UTC with the time zone. |
| The data ingestion API now returns one success per action when the action has been validated. |
Computed Datasets | |
| The Computed Dataset screen now displays a "processing" indicator when creating or updating a computed coverage. |
| The Statistics function now has computed dataset output interval options for minutes, hours, or days. |
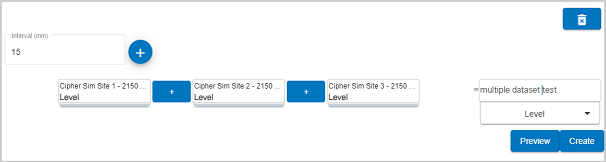
| The Math Expression function has been upgraded to allow multiple datasets and constants to be used to form a more complex equation.
|
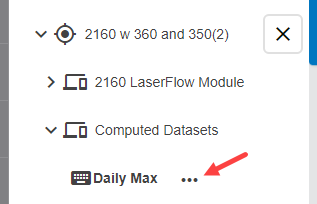
| The parameters used to define a computed dataset can now be viewed and modified using the Edit function in the menu displayed when clicking the ellipsis button (...) beside a computed dataset in a Site Selection tree. The panel with the parameters will open in the Computed Datasets screen where the parameters can be modified and the definition of the computed dataset updated. This capability will be available only for computed datasets created in Flowlink Cipher 1.1 or later.
|
Dashboard | |
| When the "Graph from site" function is selected in the site gadget the datasets selected by the user to display in the gadget will now be the datasets used to start a new graph. Previously, the function automatically re-selected the datasets to use in the new Level/Velocity/Flow Rate graph which may have been different than the datasets chosen by the user in the site gadget. |
| A new Silent Site gadget has been added to the dashboard. The gadget will display a list of sites with active alarms for missed data ingestions based on the threshold setting for Data Last Received on each site's information screen. |
| A Battery gadget has been added to the list of available gadgets for the dashboard. The Battery gadget displays the last received battery voltages for a selected list of sites. The table of sites and voltages can be sorted by clicking the column header to bring the lowest battery values to the top of the list. |
| A new Alarms gadget has been added to the dashboard. The gadget will display the number of active alarms for all sites or a list of sites with the number of active alarms for each site. |
Events | |
| The Events tab in the site information screen now allows the user to change the status of individual data alarms and silent site alarms. The life cycle of each alarm begins with Active and can transition to Acknowledged and then to Resolved.
|
General Application | |
| Data loading animations have been added to the Sites, Map and Alarms screens to indicate that the application is still processing data. |
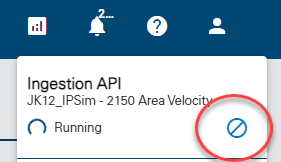
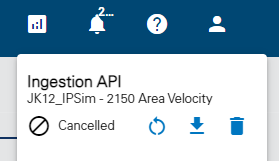
| A new Cancel Job button is available in the Jobs list to cancel a job with a status of "Waiting" or "Running". A cancelled job can be retried, deleted or have the data downloaded. A notification is not sent when a job is cancelled.
|
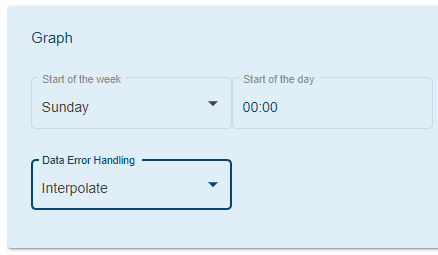
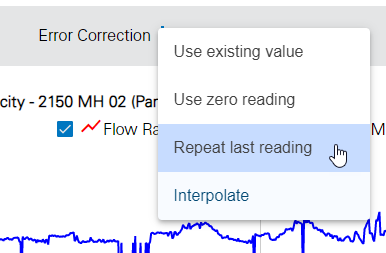
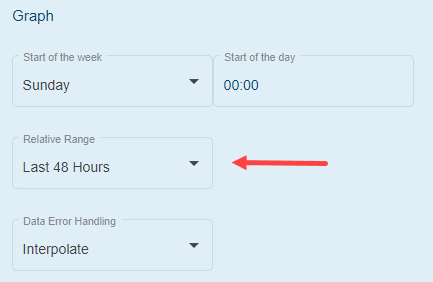
| A new Data Error Handling option is available under the Graph category of the Preferences tab on the Profile page. This option allows the user to decide how data points with error codes will be handled. There are four options: - use existing value (default) - use zero value - repeat last reading - interpolate Also, in the main graph page the user can now select which error handling to use temporarily while viewing the graph.
|
Graphs | |
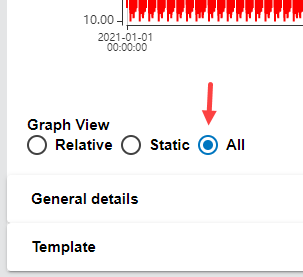
| A new "All" option on the graph configuration screen can be used to load the full time range of data available in the database when creating a new graph using the Static option. This option forces the user to actively make the choice to retrieve all of the data. Previously, when the Static option was selected, the graph would automatically retrieve all data in the database.
|
| Selecting the Sample option in the Event Type search field on the Alarms screen will now return bottle sample events in the database. Also, enabling the Display Events option in the main graph screen and selecting the Sample option for the Event Type will now display the bottle events recorded in the database.
|
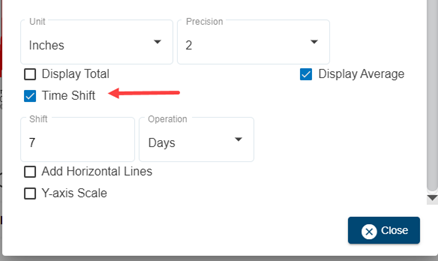
| The graph display properties for a dataset now include a Time Shift option. This option can be used to move the data forward in time by entering a positive value of minutes, or backward by entering a negative value of minutes. The original data is not changed when this option is applied. The data points in a time shifted time series cannot have their values edited.
|
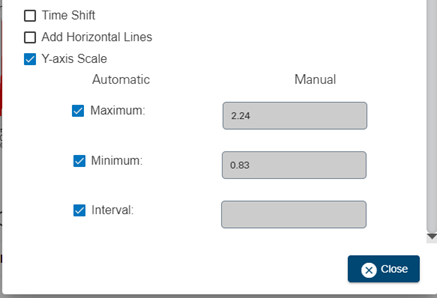
| Automatic and manual scaling options for each Y-axis are now available. The Y-axis label interval can also be determined automatically or defined manually by the user.
|
| The Auto Correct function for editing graphs now correctly interpolates new values for the selected points in the graph. The interpolation extends from the first nearest point prior to the selected data to the next point after the selected data. |
| Navigating away from the graph configuration screen now only prompts the user to save changes if there are unsaved changes. Previously, a prompt was displayed every time a user left the graph configuration screen. |
| The order of datasets in the graph legend will now match the order in which the datasets were added to the graph in the graph configuration screen. |
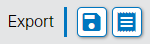
| The Export functions in the main graph screen have been replaced with two new functions: - Export graph to CSV: The CSV file is generated and sent to the Downloads folder of the current Windows user account with a file name based on the graph title and timestamp. - Export graph to PDF: A dialog box appears with Portrait or Landscape layout options. The resulting PDF now includes the title, subtitle, legend, image of the graph and the data table if the option to include the table is selected.
|
| The same dataset can now be added to the same graph pane more than once. The legend will distinguish each instance of the time series graph by appending the dataset name with a number in parentheses in the same way that Windows File Explorer identifies duplicate folder names. |
Import | |
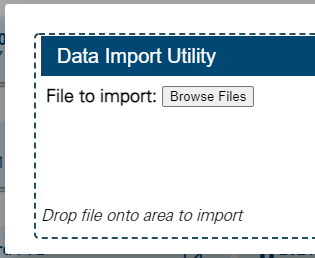
| The Data Import Utility now allows the user to browse for and select multiple files for import to Flowlink Cipher.
|
Map | |
| The point-of-interest (rain drop) symbols used on the Map screen, and the map insert on the site information screen, have been replaced with a new round symbol. The symbol will be green for active sites, grey for inactive sites, yellow for sites with a silent site alarm, and red for sites with a data alarm. |
Notifications | |
| Notifications are no longer generated when additional data is added to a dataset that has an active alarm. The original notification when the alarm was triggered is sufficient. |
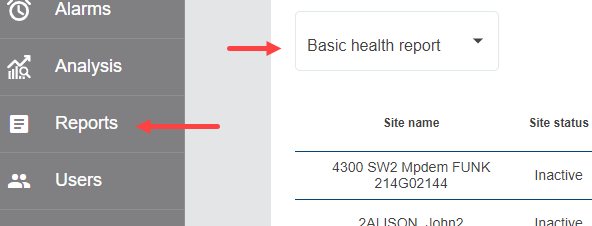
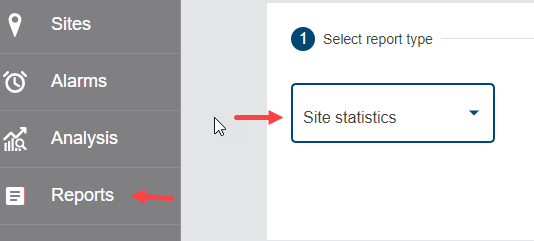
Reports | |
| A Basic Health Report tool has been added to Cipher. Select this option from the Reports page and a table of basic health information for all sites in the Cipher instance will be generated. Health information includes the status of the site, metadata about the devices, last push timestamps and more. The table can then be downloaded as a CSV file for use in other applications.
|
| A new Reports menu item has been added to the menu on the left side of the application. A new Site Report feature is available from this menu item that will produce summary statistics for a site based on the selected site, datasets, statistic type and interval. The tabulated report can be viewed by the user and then optionally stored in the database and exported to a file.
|
Sites | |
| The Events tab on the site information screen now includes the ability to filter the list by the status of alarms. Status values include Active, Acknowledged and Resolved. |
| The Sort arrow on the Sites screen now points up when the current sort is ascending, and points down when the current sort is descending. |
| The performance of the Sites screen has improved. The process that retrieves the summary information for all sites, which is used to populate the site cards, has been optimized. |
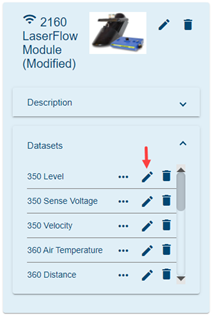
| The tooltip for the "Level, Flow and Velocity from Site" button on the site card has been changed to "Level, Velocity and Flow Rate from site" to match the order of the datasets as they will appear in the graph created by the function. |
| It is now possible to rename a dataset in Flowlink Cipher. It is important to note that the new name will only be applied in Cipher and will not be applied to the meter. Therefore, the next time the meter pushes new data, a new dataset will be created with the original name which still exists in the meter. The result will be a break in continuity of the datasets that belong to the meter. Previous data will still exist in Cipher as the renamed dataset, while all new data going forward will exist with the original dataset name.
|
| A new Merge Datasets button is available on the Sites screen. The user can now merge datasets within the same site or from one site to another site. The process allows the user to select the Source site / device / datasets to be merged with the Destination site / device / datasets. A matching Destination dataset must be selected for each Source dataset. When there is the possibility of a time range overlap, Keep Destination and Overwrite Destination options are available to address the overlap.
|
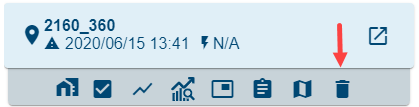
| Users with a System Administrator, Administrator or Site Manager role can now delete sites, devices and datasets.
|
Templates | |
| The default public graph template "Level, Velocity, Flow Rate template" now uses the following imperial units: - Level = inches - Velocity = feet per second - Flow Rate = gallons per minute |
User Accounts | |
| A new "Relative Range" option has been added to the user account preferences. This setting determines the default time range for relative graphs. This setting is applied when the user starts a new graph in the graph configuration screen and when the Level, Flow and Velocity from Site function is selected on the site card to start a new graph.
|
Maintenance
Flowlink Cipher
Alarms | |
| The Alarms screen table can now be filtered by the event state using the values: Active, Acknowledged, and Resolved. |
| Previously, when new data was ingested and alarm conditions were being tested, if an alarm condition included a data type that was not ingested, the alarm detection would fail in some cases. This has been repaired. |
| Some sites were experiencing an ingestion failure if a device was experiencing an on-going alarm at the time of ingestion and the data triggered the alarm at the last data point. This has been fixed. |
API | |
| The configDetails and tcpAdress fields now store the correct values, making those values available in the export API. |
Computed Datasets | |
| Previously, in some cases a new dataset could not be created using the same name as a dataset that had been deleted. Now, the names of computed datasets that have been deleted can be reused. |
| The DryFlow dialog box displayed when setting the time range for the dataset was incorrectly showing UTC timestamps on the X-axis tooltip. This has been fixed. |
Coverages | |
| Error codes from meters are now stored in Cipher. Previously, the error codes were not stored. When new data is ingested into Cipher, a new Quality band containing the error codes is now added to the coverage storing the dataset. Data ingested with an error value other than zero will, by default, result in the status flag for the point being set to Rejected. This is the same Rejected flag that a user can set manually in the main graph screen when in Edit mode. Rejected points will be processed according to the data error handling options specified in the Preferences of the current user profile. |
Dashboard | |
| When a site is selected in a site gadget, if the site does not contain data types for level, velocity and flow rate, the following message is now displayed: "Level, Velocity, Flow Rate data types not available" |
Events | |
| In some the end time for an event was not being set when new data was ingested that would no longer meet the alarm condition. This has been fixed. |
| Silent site events were not always being generated on the repeating interval defined by the Data Last Received threshold. Sometimes the intervals would be skipped or would occur one hour later. This has been fixed. |
General Application | |
| When a device or dataset is renamed, the user will no longer have to refresh the web browser to see the new names in the data tree in the graph configuration and computed datasets screens. |
| Completed jobs are now automatically removed from the Job Queue. In cases where the job is not removed, a button has been added to manually remove the job from the Job Queue. |
| An error was appearing in the console window of the web browser when a user was loading data and switched to another page before the data loading was complete. This affected the dashboard and the graph pages. This error no longer appears in the console window. |
Graphs | |
| The minimum/maximum range of values for the axes in the scatterplot now match the range of data values for the points in view. As the user steps through the data using the navigation controls the range of values in the axes will update as expected. |
| The data table in the main graph screen will now open as expected when a dataset appears more than once in the graph. Previously, a duplicated dataset in the graph was disabling the data table. This has been fixed. |
| Scrolling of the table in the main graph screen is now working correctly. Previously, the table would flicker and jump when scrolling up or down through the data in the table. |
| Deleting a graph from the Analysis screen while a filter was applied to the list of tiles was not removing the deleted graph from the filtered list unless the Web browser was refreshed. This has been fixed. Deleting a graph will now remove it from the filtered list of tiles. |
| The Proportional Adjustment edit function now correctly distributes the specified correction value proportionally across the selected points in the graph. |
| The Proportional Adjustment edit function now correctly distributes the specified correction value proportionally across the selected points in the table. |
IPReceiver | |
| Data ingestion failures that occurred in some cases when the site also had active alarms have been resolved. |
| The API now sends the data ingestion acknowledgement earlier. The updating of the timestamp for last data received now occurs after the acknowledgement is sent. The alarm settings are now checked after the acknowledgement is sent. |
| An intermittent problem with the Relative graph option retrieving data to display in the graph has been solved. Previously, when an existing site had a time gap in the data that was later filled with subsequent data ingestions, the Relative option would not populate the graph in the graph preview screen. |
Notifications | |
| Previously the notifications for new sites and alarms were not being sent reliably to the subscribed users. This problem has been solved. |
Sites | |
| Existing site groups that were created outside of a tenant in some cases could not be deleted. This has been fixed. |
| When importing CSV files, the Job Queue would sometimes display a job as Running for a period of time long after the import process had completed and the site created. This has been fixed. |
| The icon on the Inactive Sites button on the Sites screen now appears bright when the inactive sites are displayed, and dark when the inactive sites are hidden. |
| On the site cards in the Sites page, a site that does not yet have any data ingested will now display "N/A" as the timestamp for the last received data. Previously a timestamp in 1969 was displayed. |
| When the coordinates of a site are updated and saved, the map insert on the site information page will now update to display the position of the site on the map. When the full Map page is opened, the site will be displayed in its new position. |
Tenants | |
| Previously when a tenant was deleted, the Tenants tab in the Settings screen would indicate, in some cases, that the tenants system had not yet been activated. This problem has been fixed. |
User Accounts | |
| The System Administrator role can no longer be assigned to a user in a tenant. Previously, a user in a tenant could be assigned the System Administrator role which was incorrect. Only Global users can now be System Administrators. |
| The default units for the Volume data type has been changed to Gallons. Previously, the default was Cubic Meters (m3). This change will only be applicable to new user accounts. Existing users can manually update the default units in the user account Preferences tab if needed. |